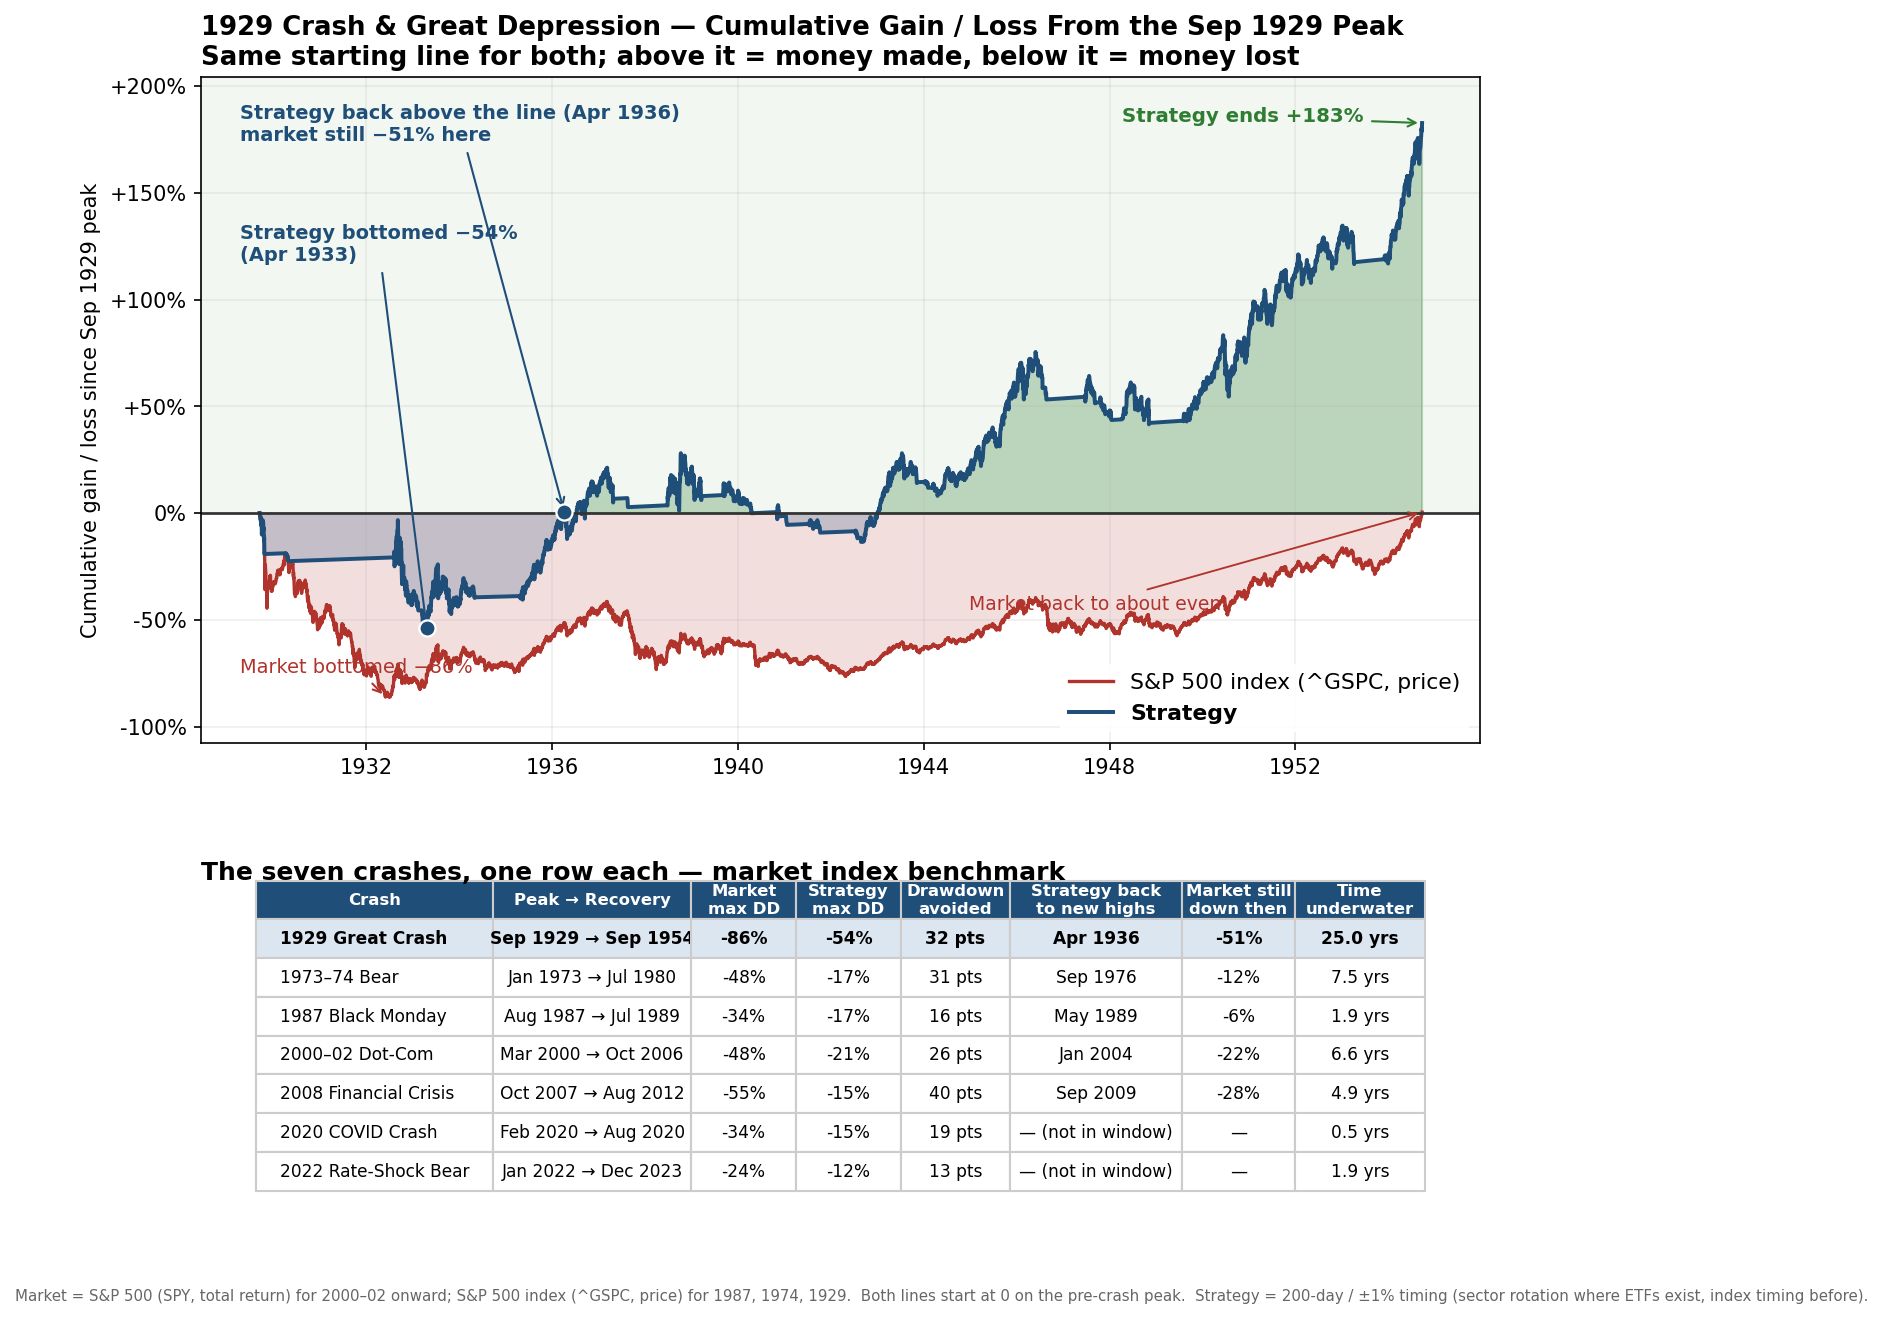
Each sector stepped to cash on its own schedule as trends broke through late 1929. Under a third of the market’s pain, not by prediction, but by following confirmed trend breakdown, sector by sector.
When the market broke and where the strategy stood
From the peak in September 1929 to the bottom in the summer of 1932, an investor holding the whole market lost about 84% of their money, dividends included. It then took until February 1945, roughly 15 years, just to get back to even. Everything on this page is measured from that September 1929 peak, where both lines on the chart below begin. Our strategy’s low point came in March 1933, about 26% below that starting line, under a third of the market’s pain, for a simple reason: each sector steps out of the market when its own trend turns down, and waits in safe Treasury bills until the trend turns back up.
Our strategy is really eleven small strategies, one for each sector, and each one steps aside on its own. As trends broke through late 1929, the sectors walked to cash one at a time rather than in a single moment, and they came back the same way, whenever their own trend repaired. That is why the strategy’s line eases down and stair-steps back up. Eleven separate signals also rarely get faked out in the same week, so the whipsaws that punished any single signal in those violent years largely averaged out across the portfolio.
The strategy climbed back above its 1929 starting line in May 1933, while the market was still about 66% underwater with a dozen years of recovery ahead of it. By the end of 1939 the strategy stood 92% above the old peak while the market remained deep in the hole. This study uses reconstructed sector data from Kenneth French’s daily industry records, the full methodology, and the caveats, are in the research note.