Pre-launch Free until year end, then $35 a month. Get Started

Twice this century, the market has fallen by half.

For investors protecting a lifetime of savings: one published rule for when to own each of the 11 S&P 500 sectors and when to wait in cash.

An Absolute Return Strategy • Rules-Based • Sector-Level
The rule
Eleven S&P 500 sector ETFs, a 200-day moving average signal, and rules that are published and never changed.
What you receive
The full signal table for all 11 sectors at the end of each week, with plain-English notes on what changed.
What it costs
Free during pre-launch, then $35 a month once payments go live.
See How the Rule Works See the Sector Monitor

General market commentary and educational content only. Not personalised investment advice. Not registered as an investment adviser.

“Equal weighting decides how to spread risk. The 200-day rule decides whether to take the risk at all.”

01 · Equal weight

All 11 sectors, 9.09% each. No sector quietly becomes the whole portfolio.

02 · The 200-day rule

Own a sector in an uptrend. Step to cash, earning T-bill interest, when the trend breaks.

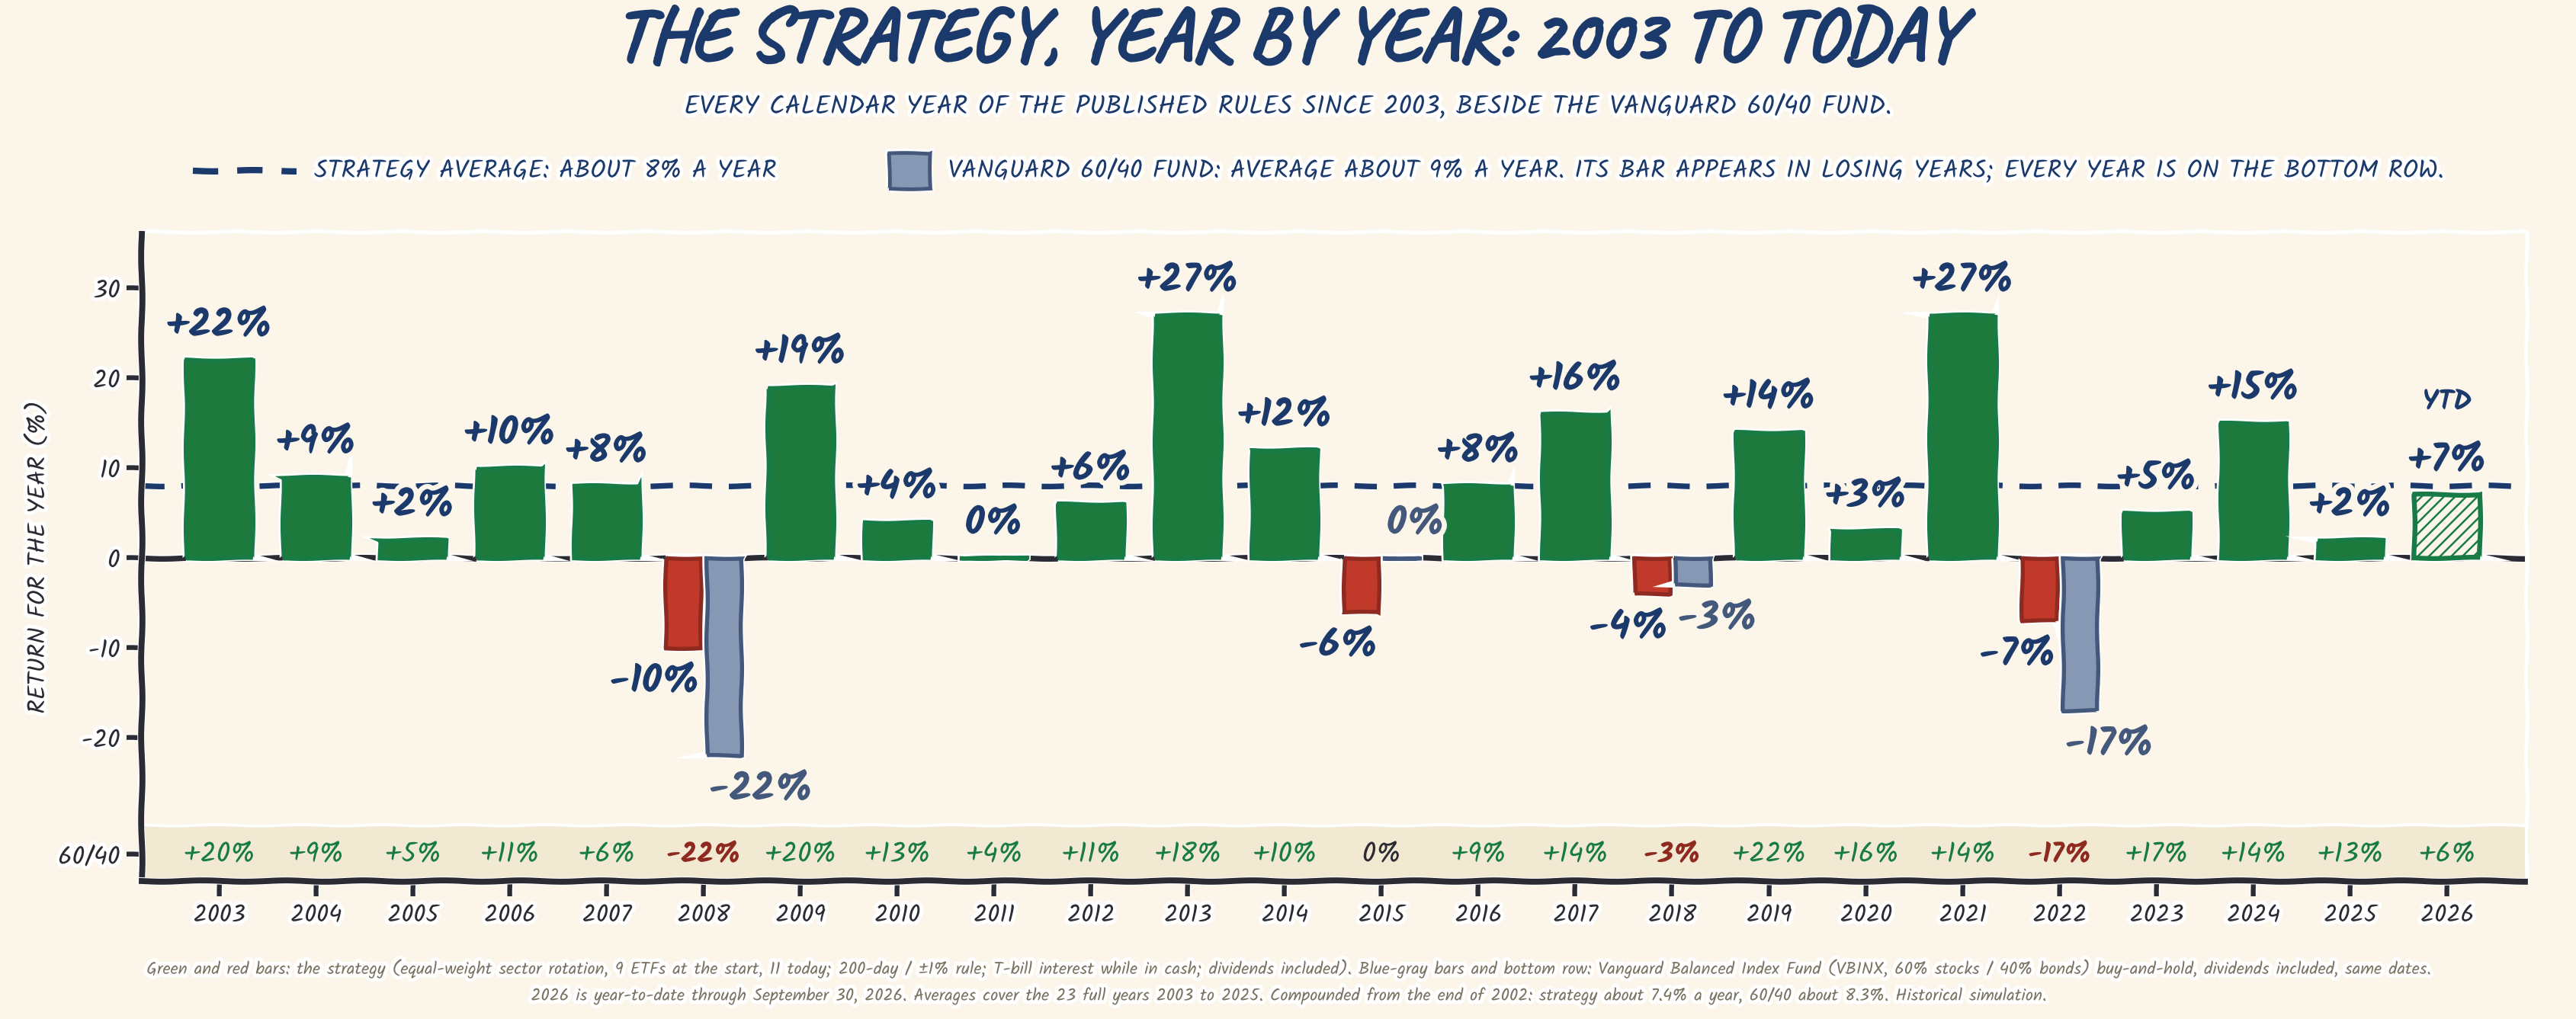
Absolute return, year by year.

The strategy's return for every calendar year from 2003 through 2026 year-to-date, shown beside the Vanguard 60/40 fund
Every year of the published rules since 2003, beside the Vanguard 60/40 fund. Click to enlarge.

The protection has a price: the strategy lags in long bull markets. See what it costs →

The Sector Monitor: 8 of 11 sectors invested.

A sample readout, as of the close on July 31, 2026.

XLK XLF XLV XLY XLI XLP XLE XLU XLB XLRE XLC

This is the product: the full signal table for all 11 sectors at the end of each week. →

Tested against every major crash since 1929.

2008
Market −55%
Strategy −15%
2000
Market −48%
Strategy −21%
1929
Market −84%
Strategy −26%

Simulated from the published rule. Method and sources →
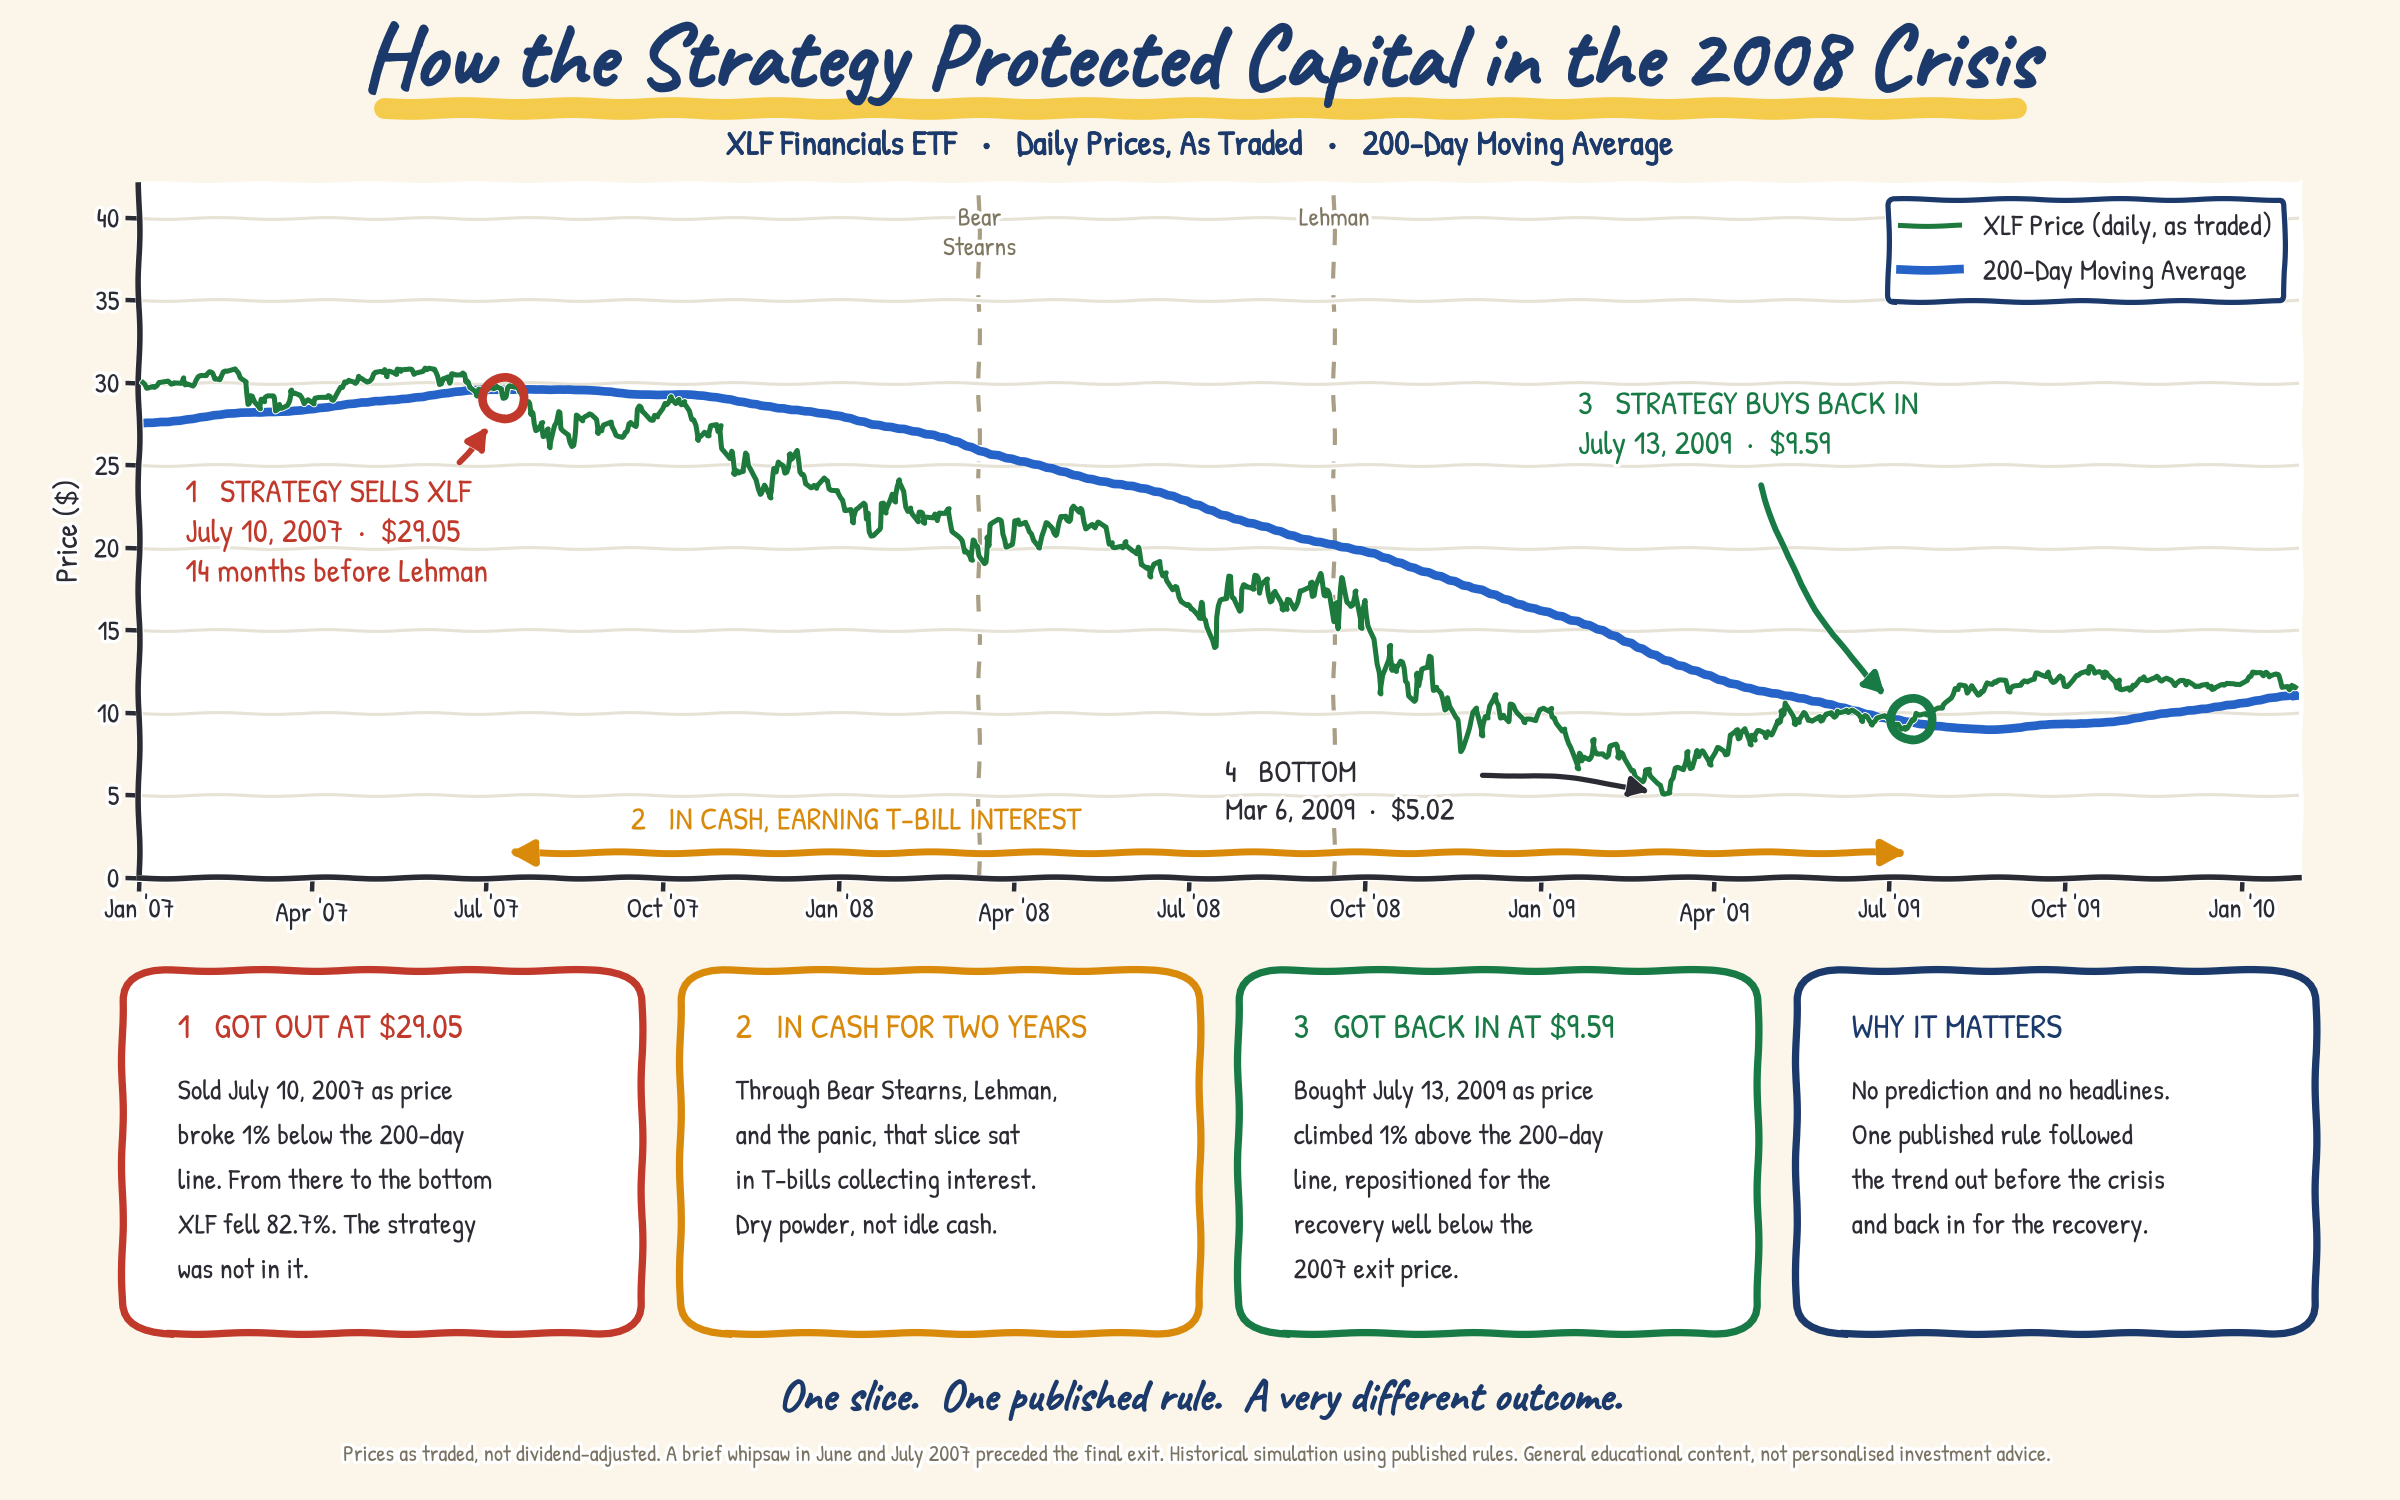
How the strategy protected capital in the 2008 financial crisis, XLF sold July 2007, in cash for two years, bought back July 2009
2008, one sector up close: out in July 2007, back in for the recovery. Seven crashes, seven studies →

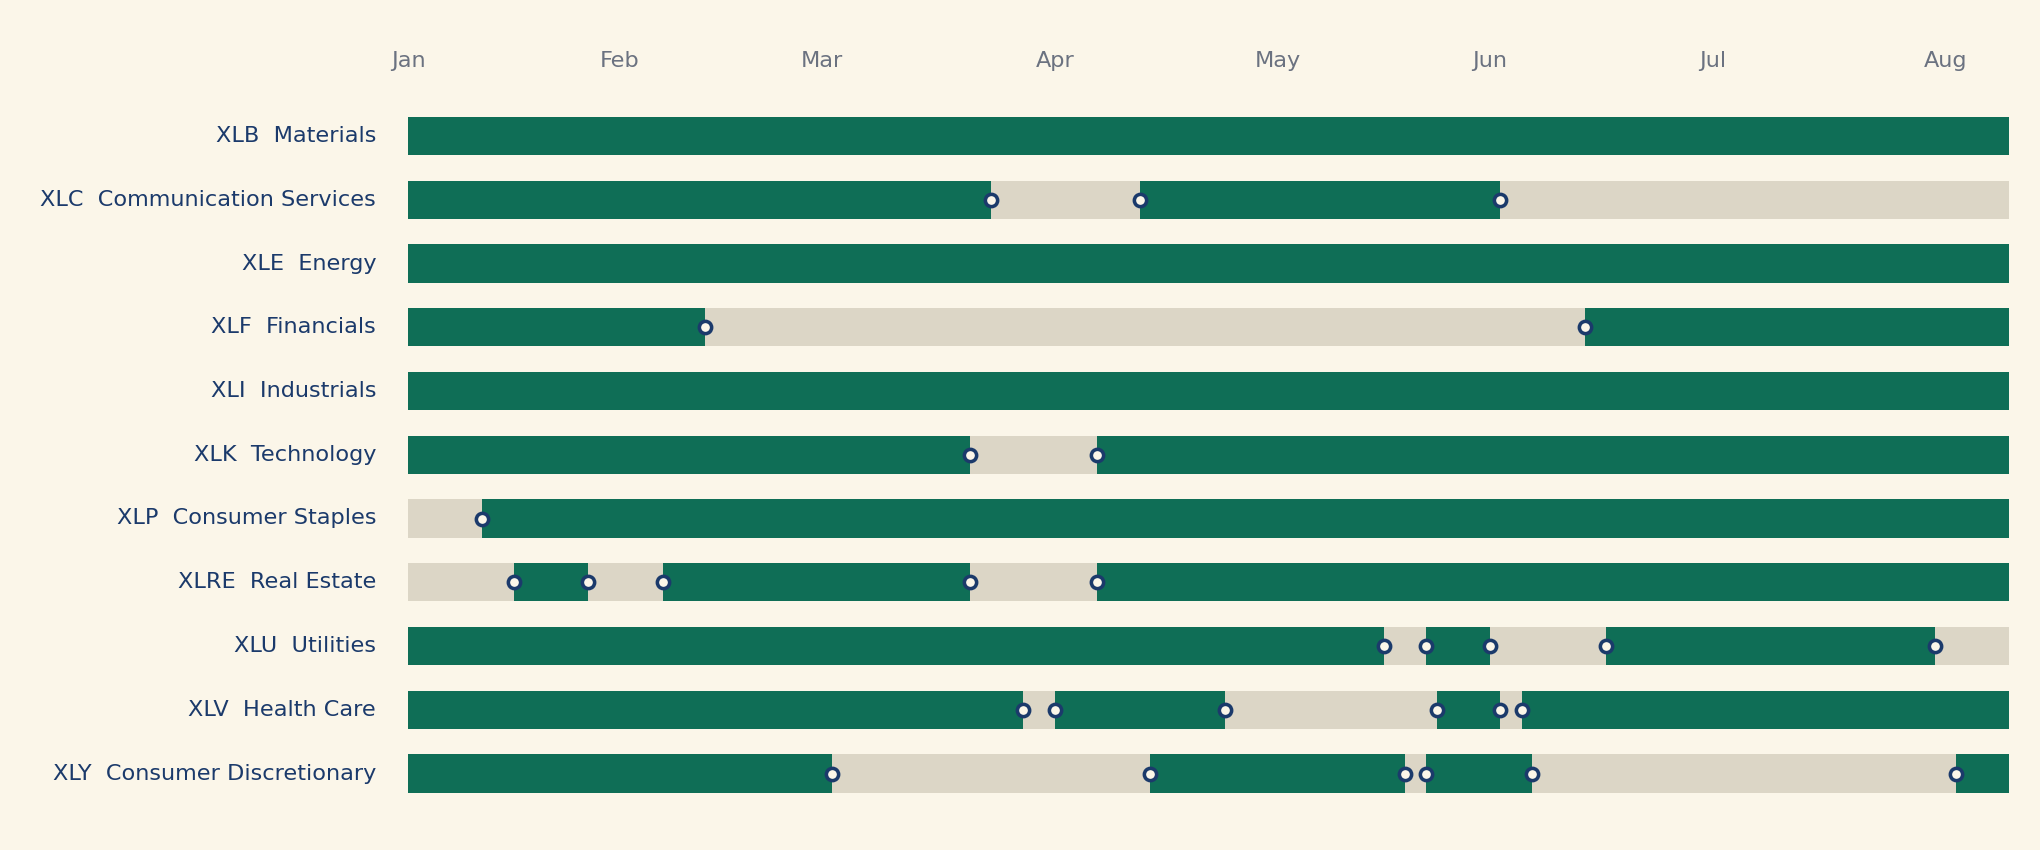
This year, day by day.

One strip per sector for 2026, green where the strategy owned the sector and grey where it stood in cash, with a dot at every position change
Green where the strategy owned a sector, grey where it stood in cash. A sample of the record, January 2 to August 10, 2026: 30 position changes, and 3 sectors that never moved at all. See the full record →

John Feingold built the strategy and answers for every number in the report.

Meet John →

One plan, everything included, $35 a month once payments go live and free during pre-launch.

Subscribe · $35 / month