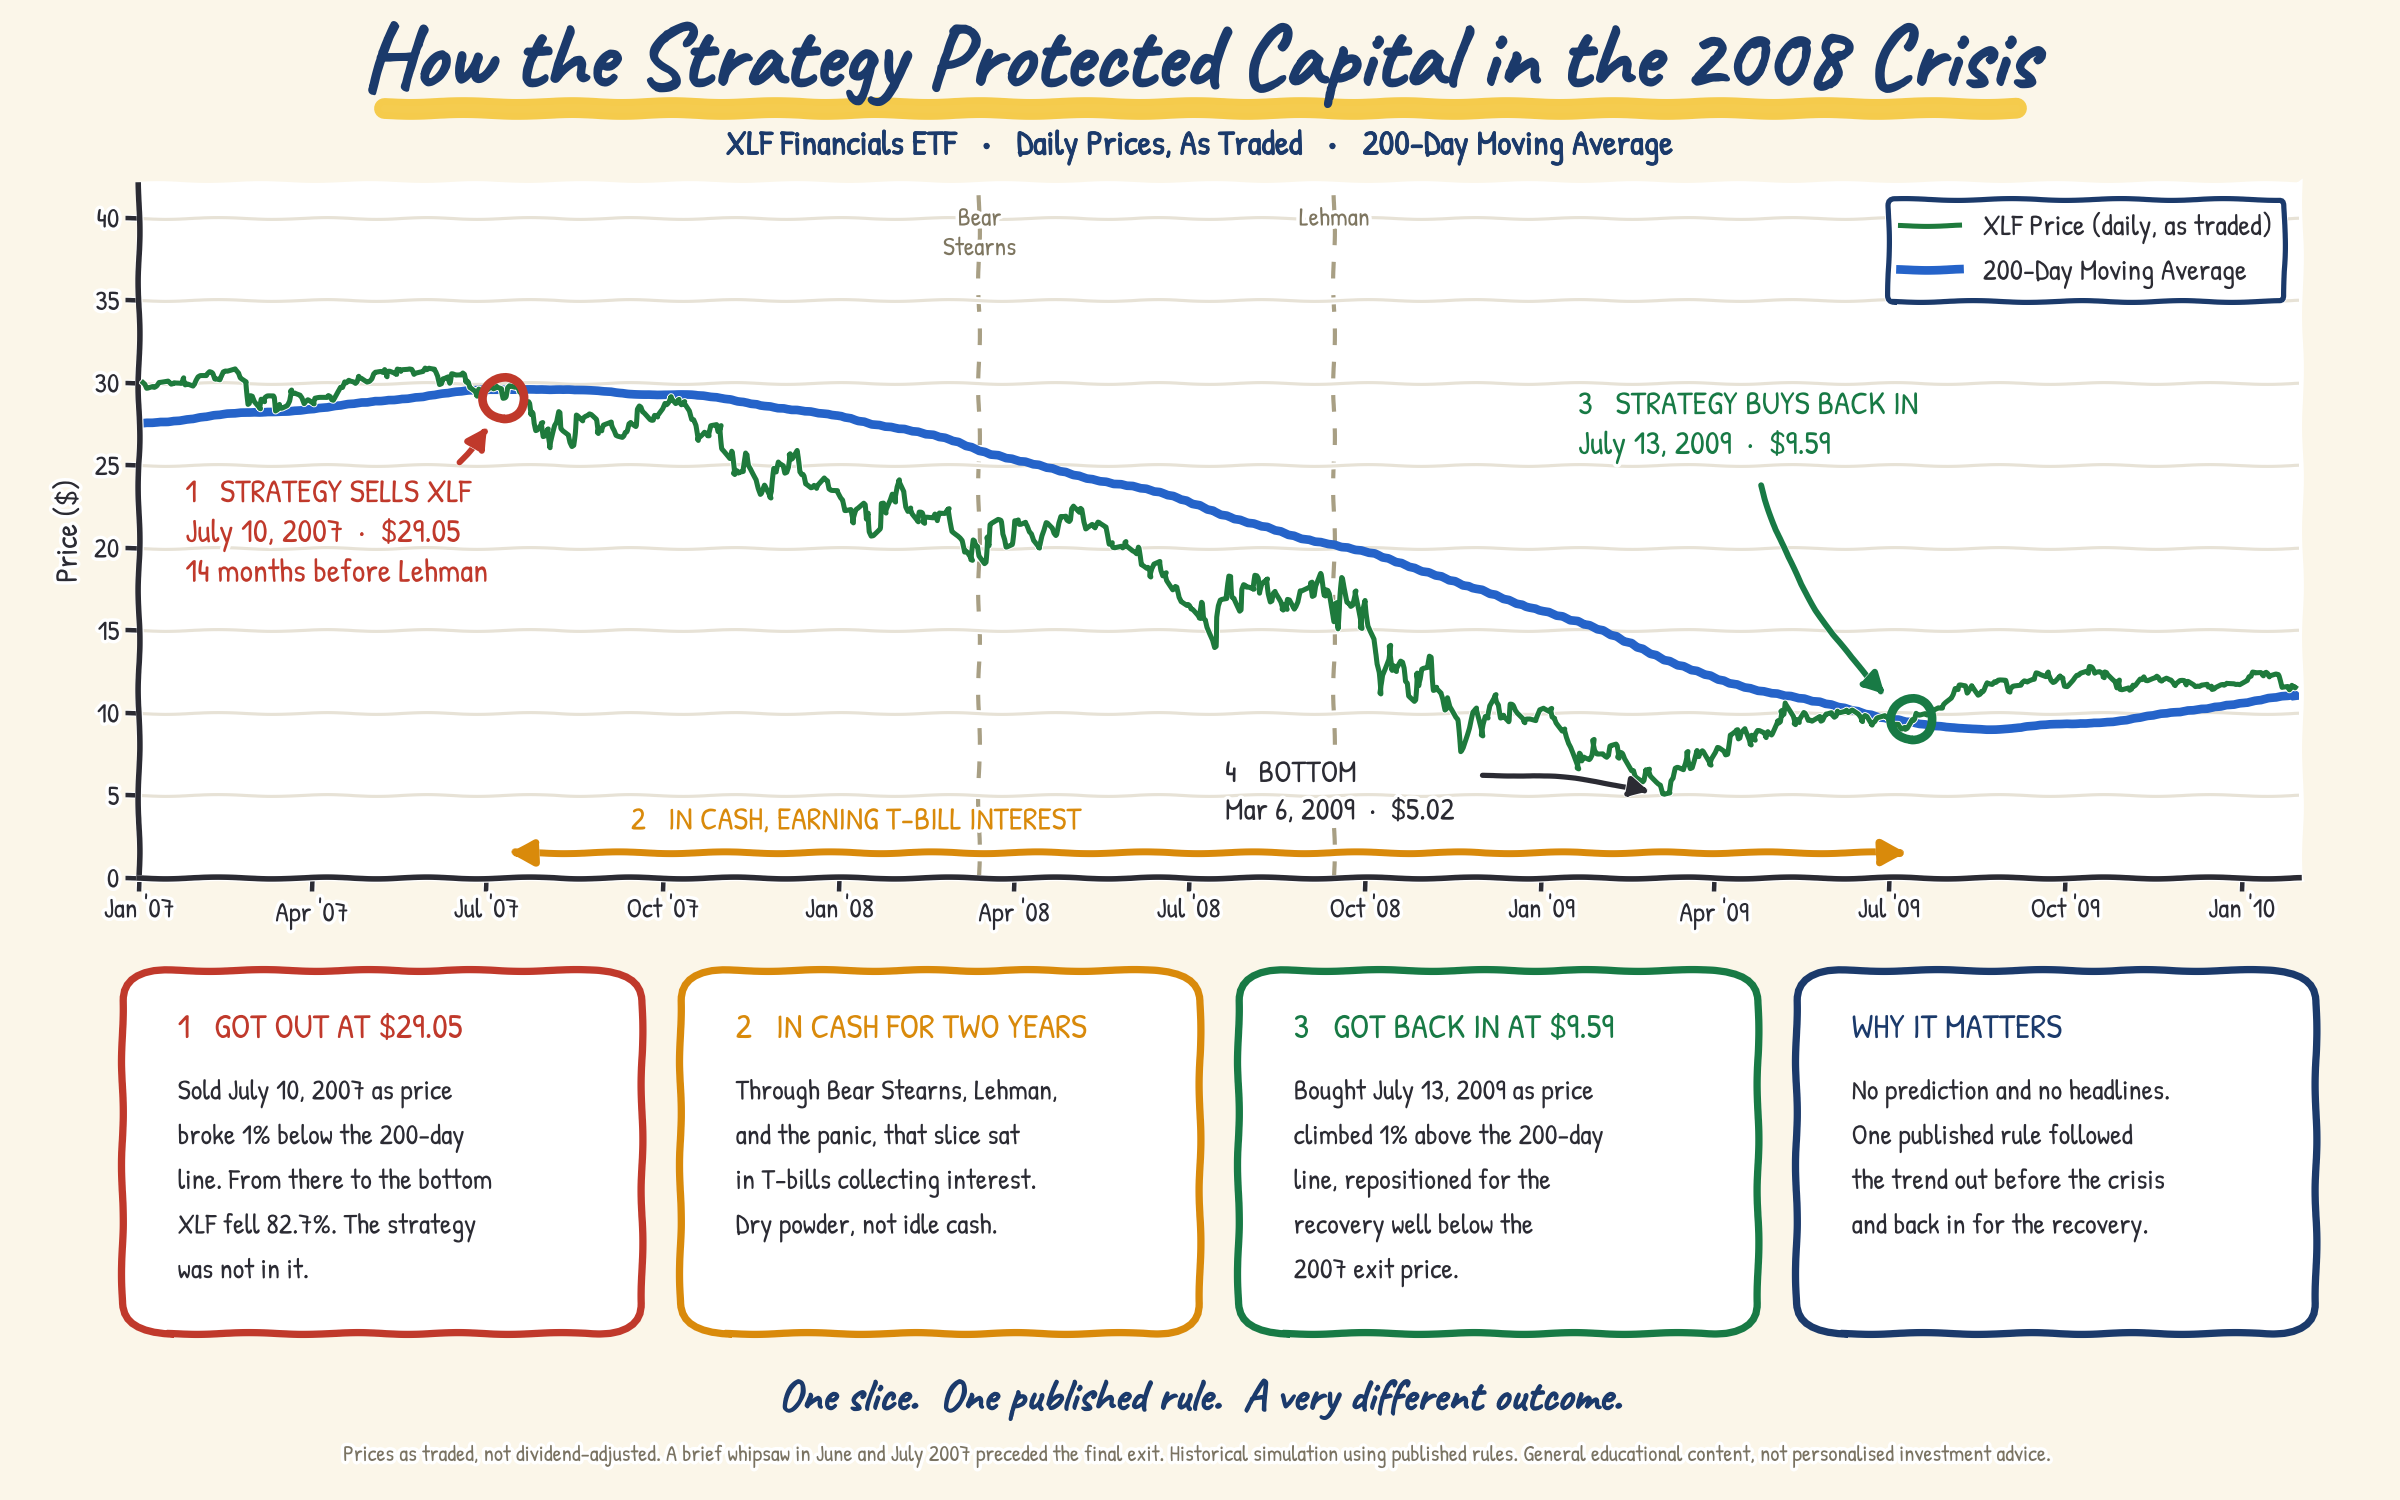
Sectors began breaching their 200-day thresholds as early as July 2007, financials first, well ahead of the accelerating declines of 2008. A fraction of the pain of the market.
When the market broke and where the strategy stood
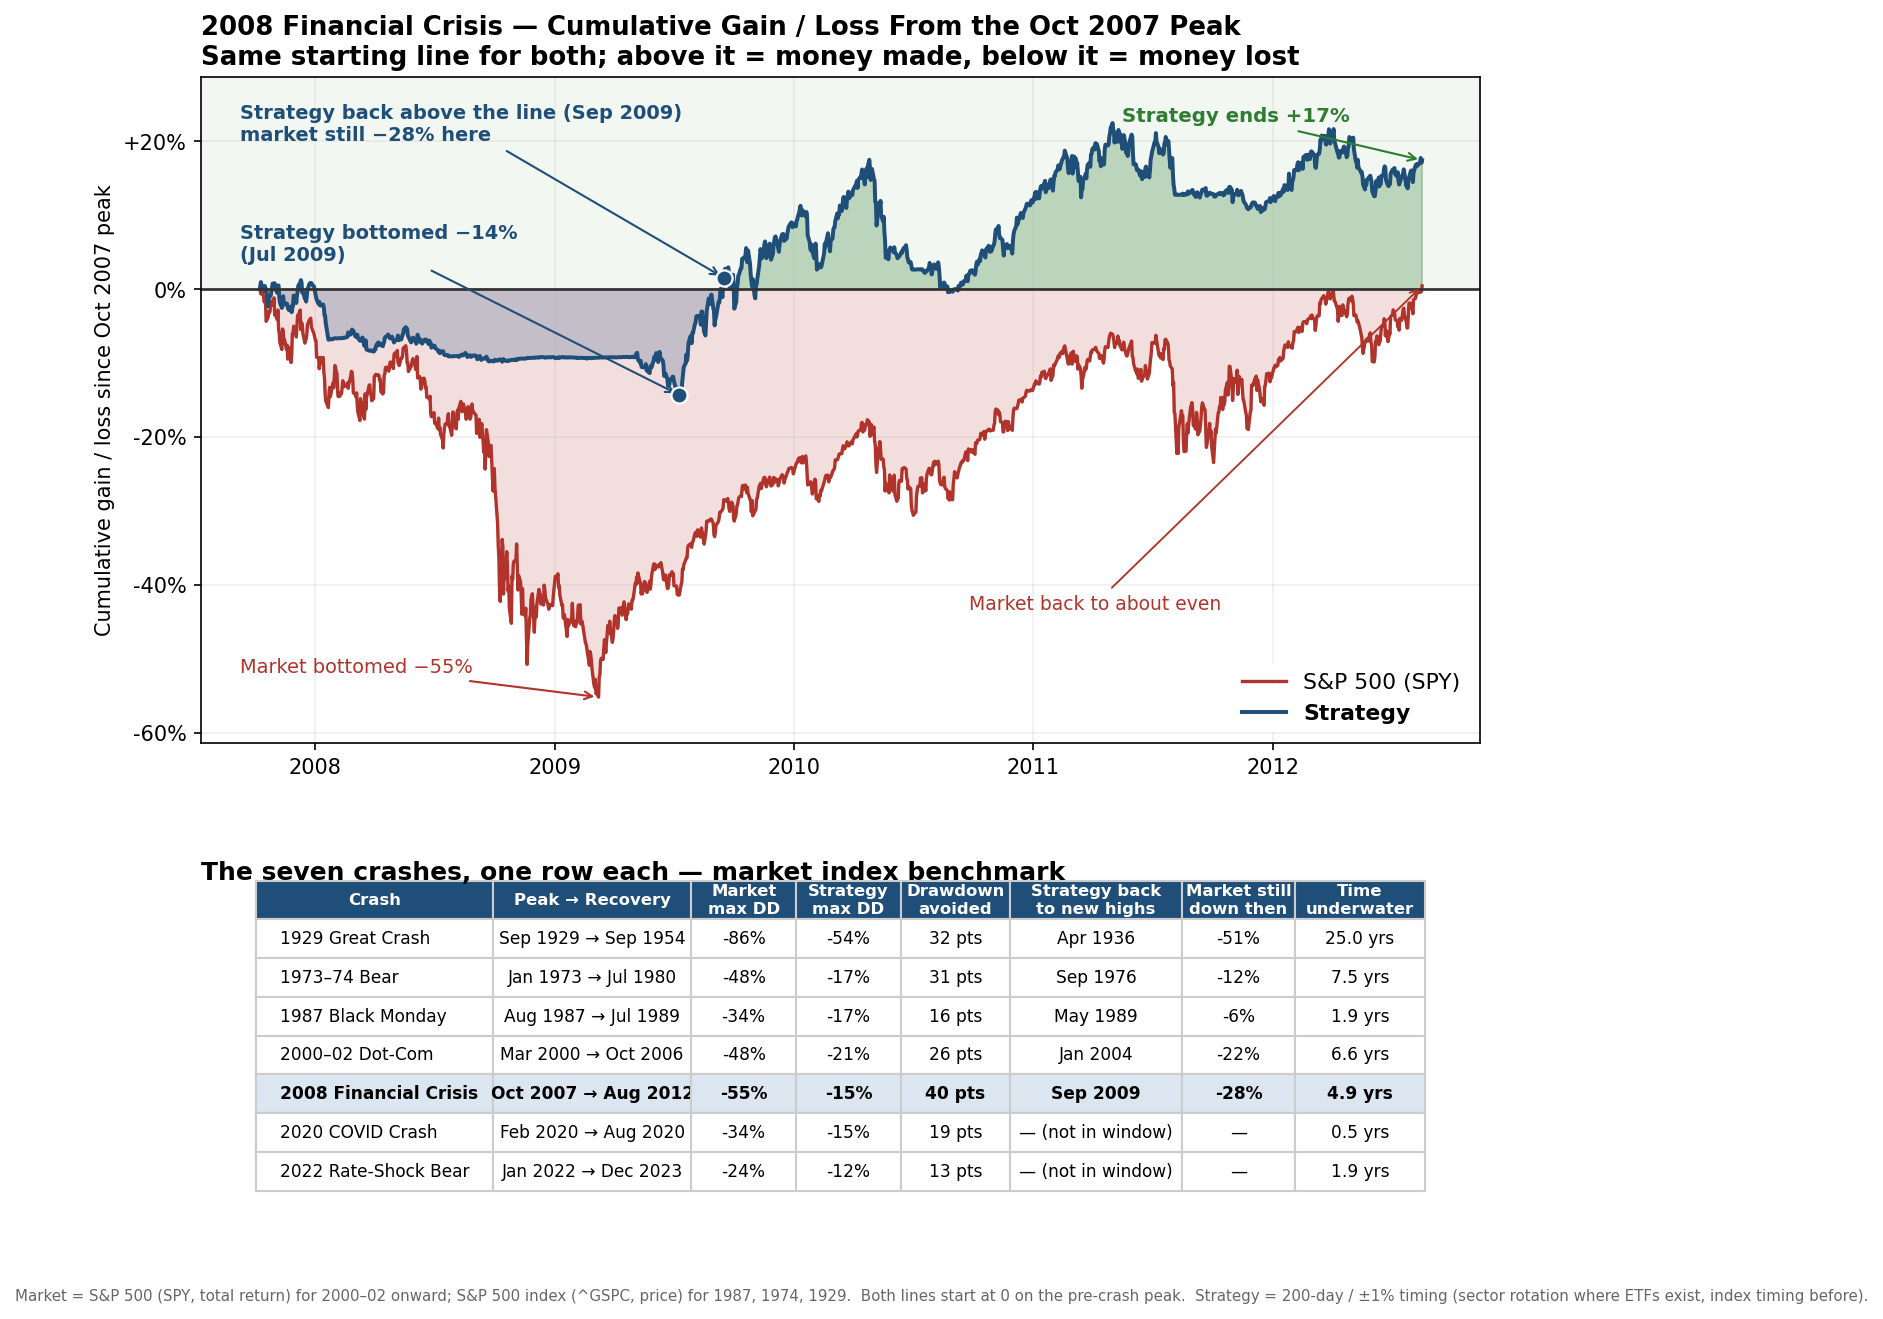
From the peak in October 2007 to the bottom, the S&P 500 fell about 55%. It then took until August 2012, roughly 5 years, just to get back to even. Over that same stretch, the worst our strategy ever fell was about 15%. A fraction of the pain, for a simple reason: the strategy steps out of the market when the trend turns down, and waits in safe Treasury bills until the trend turns back up.
Underneath, the strategy is many small strategies, one for each slice of the market, and each one steps aside on its own. Financials broke first, stepping to cash in July 2007, and by December other sectors had been in confirmed downtrends long enough to breach the 200-day threshold, so the rule walked to cash gradually, not in a single moment. Treasury bills paid very little in those years, so when the strategy was in cash its line is close to flat. That is why the line eases down and stair-steps back up rather than moving in one sharp jump.
The strategy climbed back to new highs in September 2009, while the market was still about 28% underwater with years to go. While the market was still deep in the hole, the strategy was already making new money.