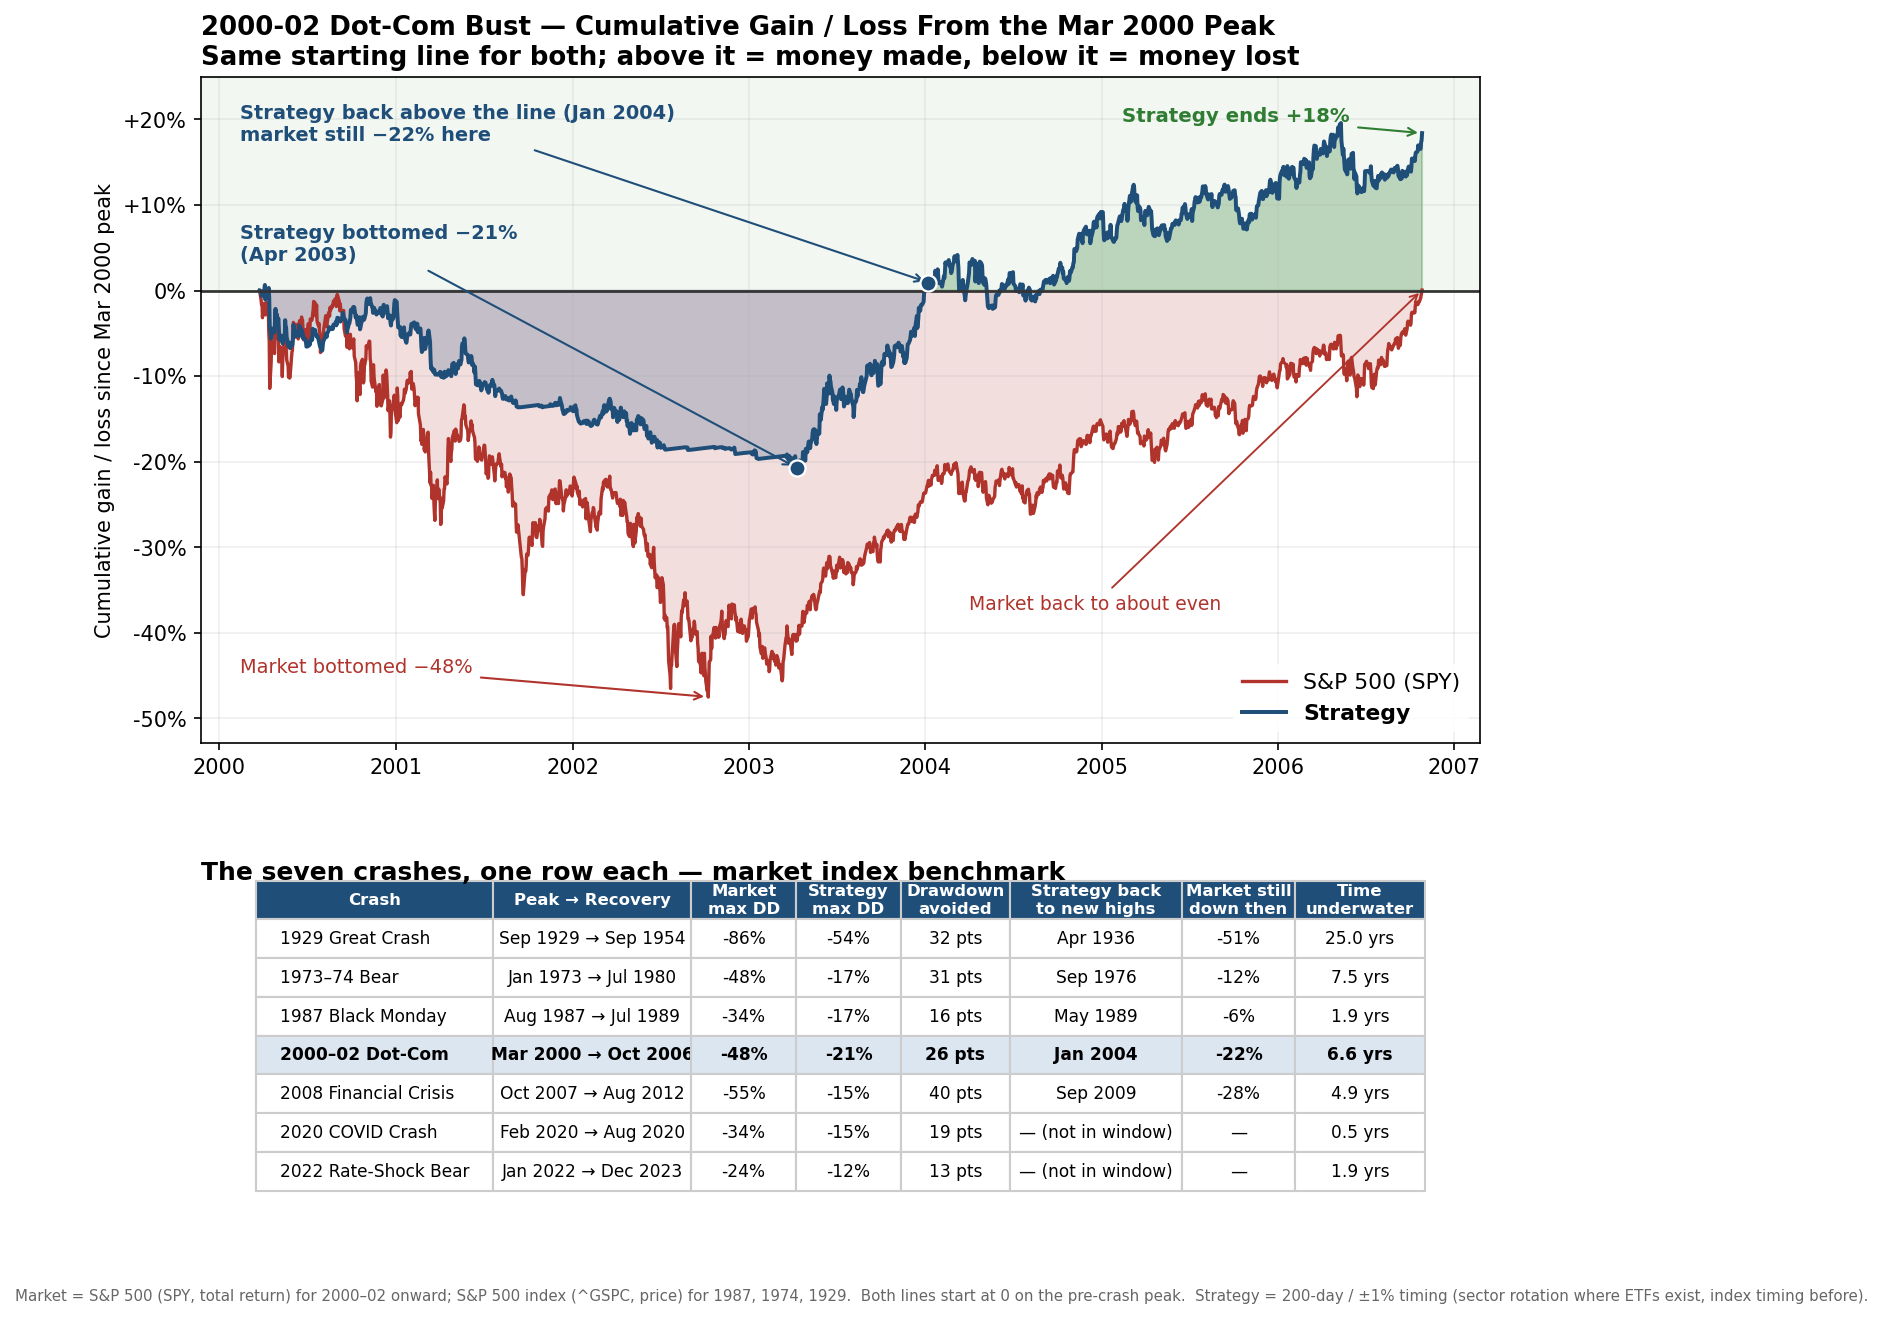
Each sector stepped aside on its own as its trend broke. Less than half the pain of the market, and back at new highs almost three years before the market.
When the market broke and where the strategy stood
From the peak in March 2000 to the bottom, the S&P 500 fell about 48%. It then took until October 2006, roughly 7 years, just to get back to even. Over that same stretch, the worst our strategy ever fell was about 21%. Roughly half of the pain, for a simple reason: the strategy steps out of the market when the trend turns down, and waits in safe Treasury bills until the trend turns back up.
Our strategy is really many small strategies, one for each slice of the market, and each one steps aside on its own. It does not sell everything in a single moment; it walks to cash gradually and walks back in gradually. Treasury bills paid around 3% a year over that stretch, so while parked in cash the strategy still earned a modest, steady return. That is why the line eases down and stair-steps back up rather than moving in one sharp jump.
The recovery arrived years ahead of the market's. The strategy climbed back to new highs in January 2004, while the market was still about 22% underwater with years to go. While the market was still deep in the hole, the strategy was already making new money.
Technology was the hardest-hit sector in this crash. For a closer look at how the rule handled it alone, read the dot-com bust research note.