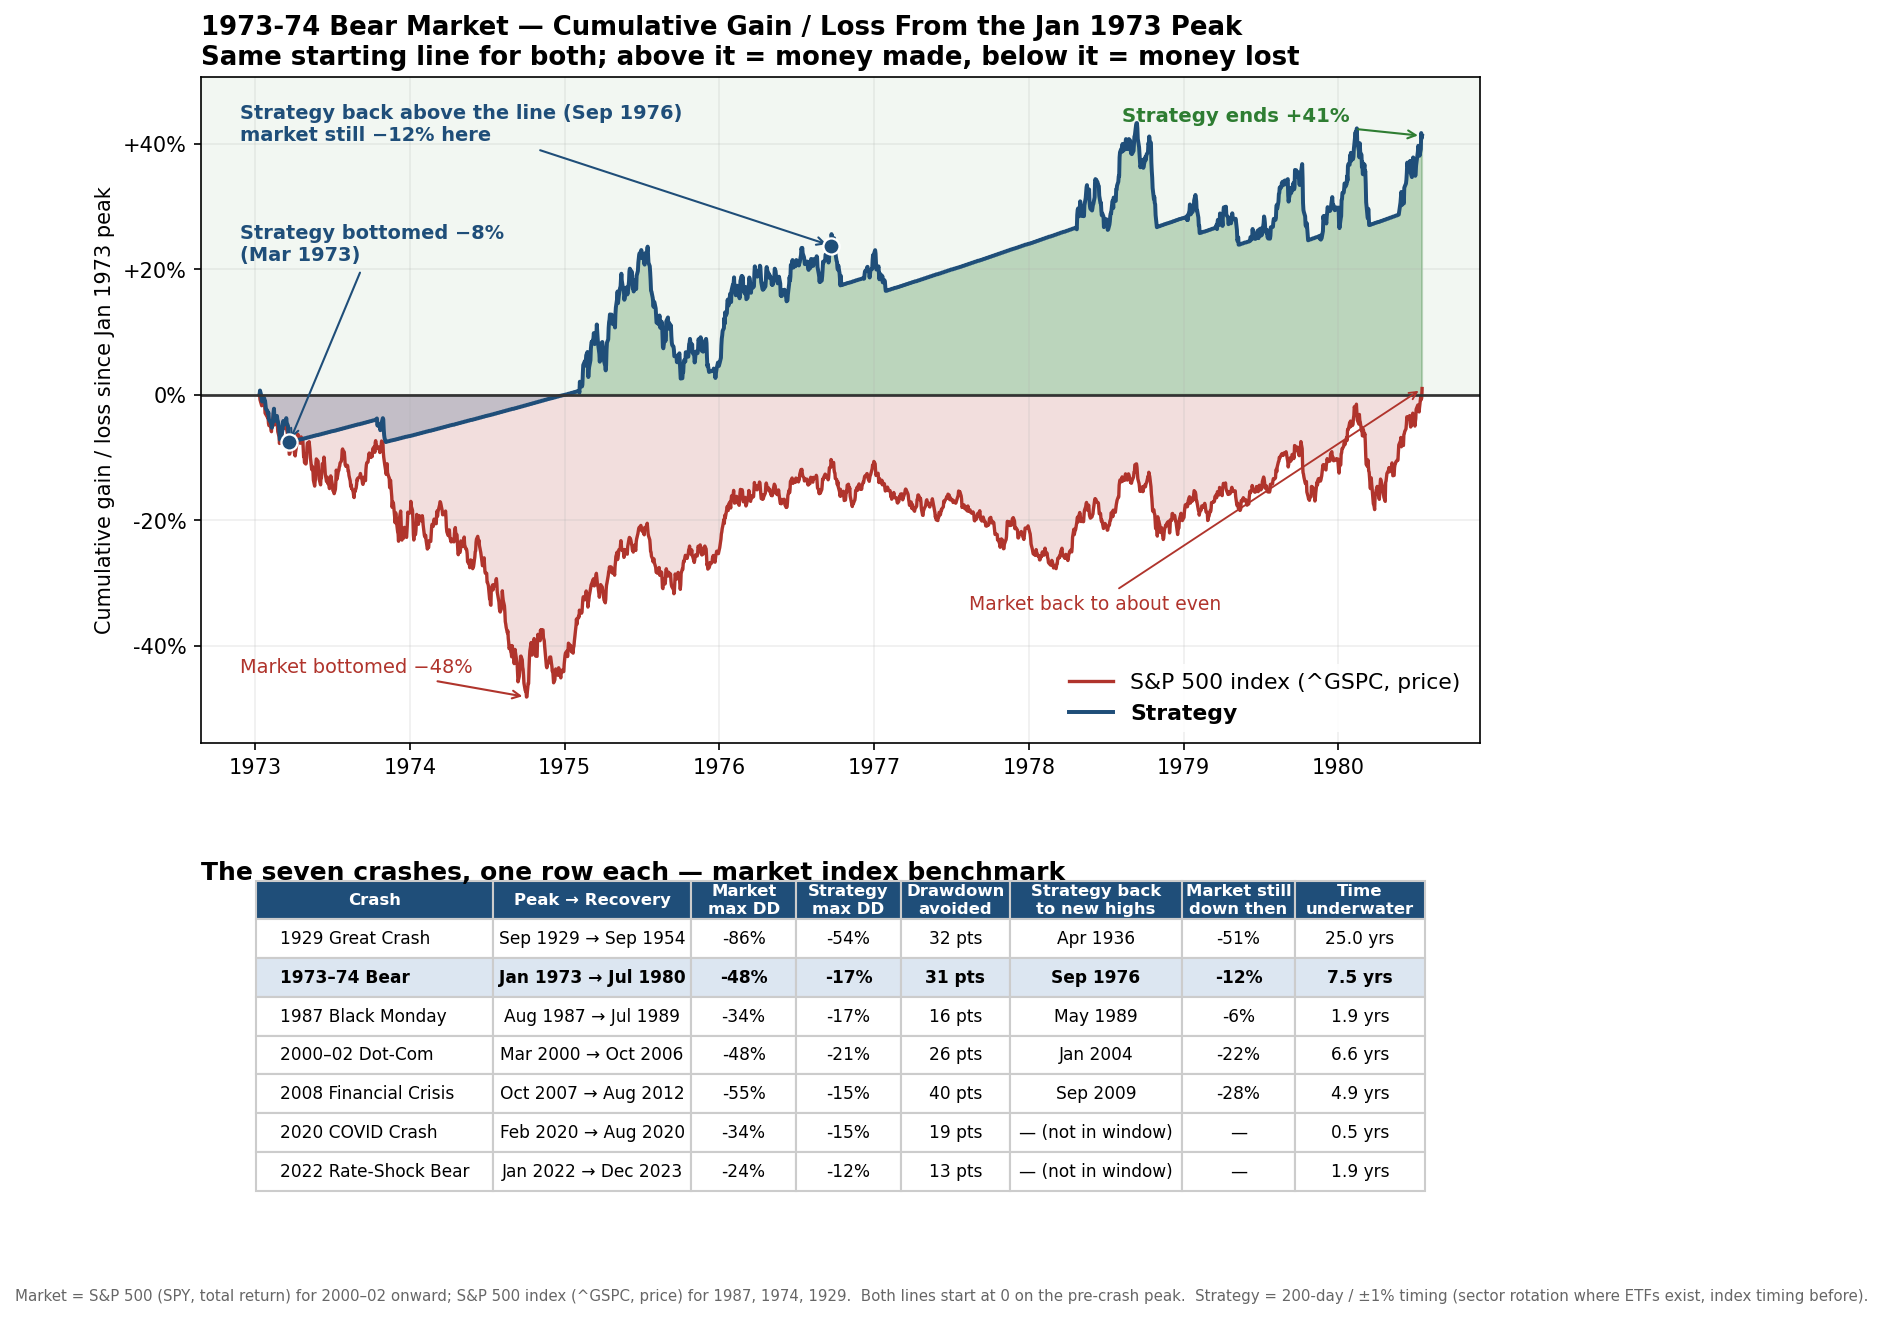
Sectors stepped to cash one by one as trends broke through 1973 and 1974, with T-bills earning about 7% along the way. Through a long, choppy bear the strategy never sat more than about 5% below where it started at the January 1973 peak.
When the market broke and where the strategy stood
From the peak in January 1973 to the bottom in October 1974, an investor holding the whole market lost about 48% of their money, dividends included. It then took until December 1976, roughly four years, to get back to even. Over that same stretch the worst our strategy ever fell was about 16%, and it never sat more than about 5% below where it started on the day the market peaked in January 1973. A fraction of the pain, for a simple reason: each sector steps out of the market when its own trend turns down, and waits in safe Treasury bills until the trend turns back up.
Eleven sectors means eleven small strategies, and each one steps aside on its own. The 1973 to 1974 bear was long and choppy, full of false rallies, and individual sector signals were whipsawed in and out more than once. What kept the portfolio nearly flat through it all was equal weighting: eleven separate signals rarely stumble in the same week, so the individual chop averaged out. In the mid-1970s Treasury bills also paid around 7% a year, so cash itself was earning real money while the strategy waited.
Recovery came early. The strategy climbed back above its January 1973 starting line in December 1974, while the market was still about 43% underwater with two years of recovery ahead of it. While a market investor was still deep in the hole, the strategy was already making new money. The methodology and caveats are the same as our 1929 sector study, and are spelled out in that research note.