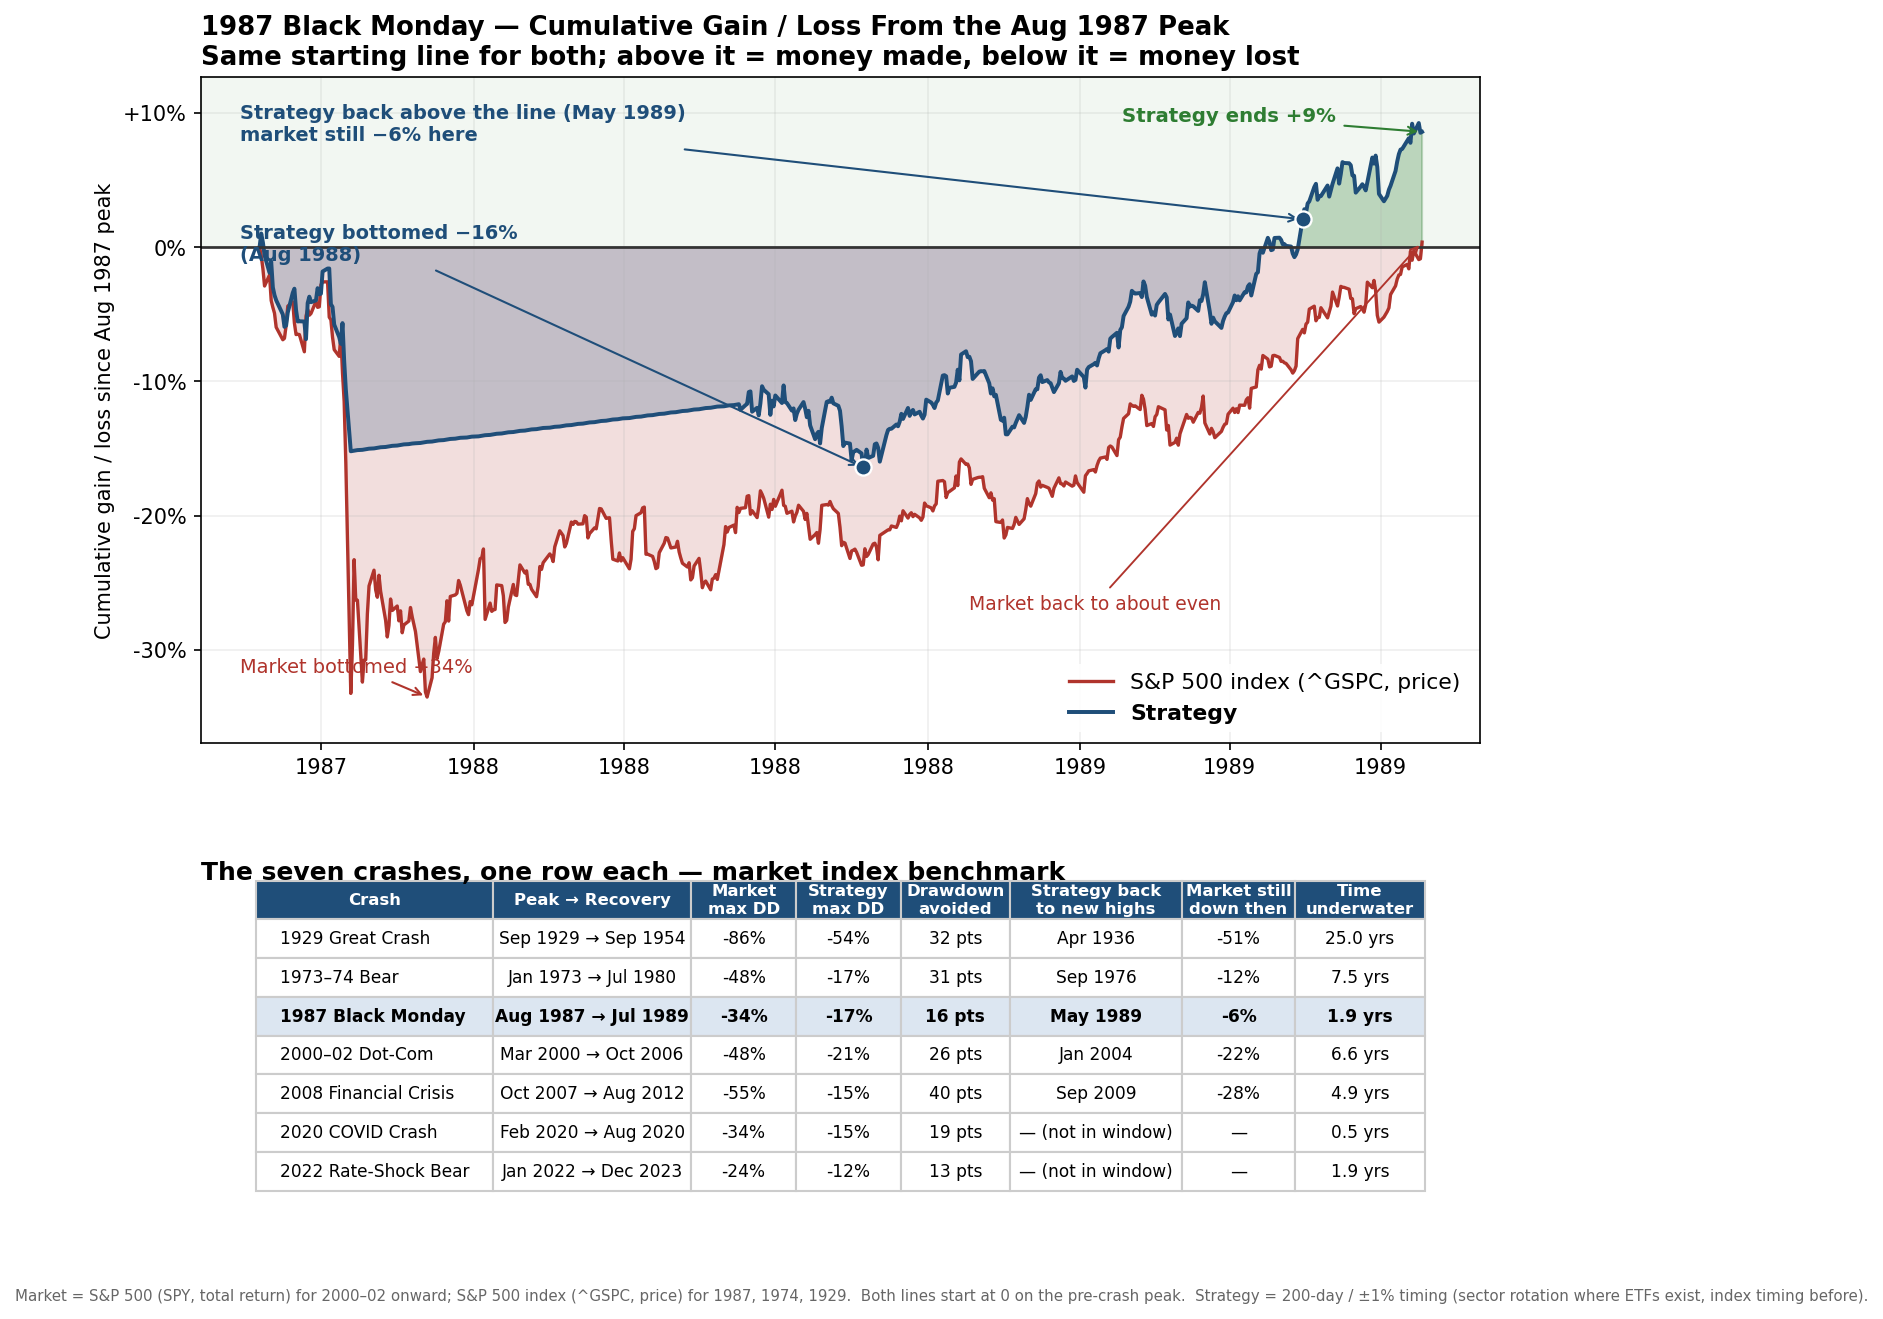
Sectors moved to cash as trends broke after the October crash, with T-bills paying 6 to 7% while the strategy waited. Roughly half the market’s drawdown.
When the market broke and where the strategy stood
From the peak in August 1987 to the bottom that December, an investor holding the whole market lost about 33% of their money, dividends included, and did not get back to even until May 1989. Over that same stretch the worst our strategy ever fell was about 16%, roughly half the market’s drawdown, for a simple reason: each sector steps out of the market when its own trend turns down, and waits in safe Treasury bills until the trend turns back up.
Black Monday was a single-day crash: it arrived before any trend had broken, so the strategy was still largely invested and took a similar first hit. What happened next is the difference. As sector trends broke, the rule moved those slices to cash, held the damage near 16%, and collected 6 to 7% Treasury bill interest while it waited. When trends repaired, it stepped back in. The rule does not dodge a bolt from the blue, but it does keep a bad day from becoming a bad year.
The strategy climbed back above its August 1987 starting line in April 1989, while the market was still about 2% underwater. The methodology and caveats are the same as our 1929 sector study, and are spelled out in that research note.