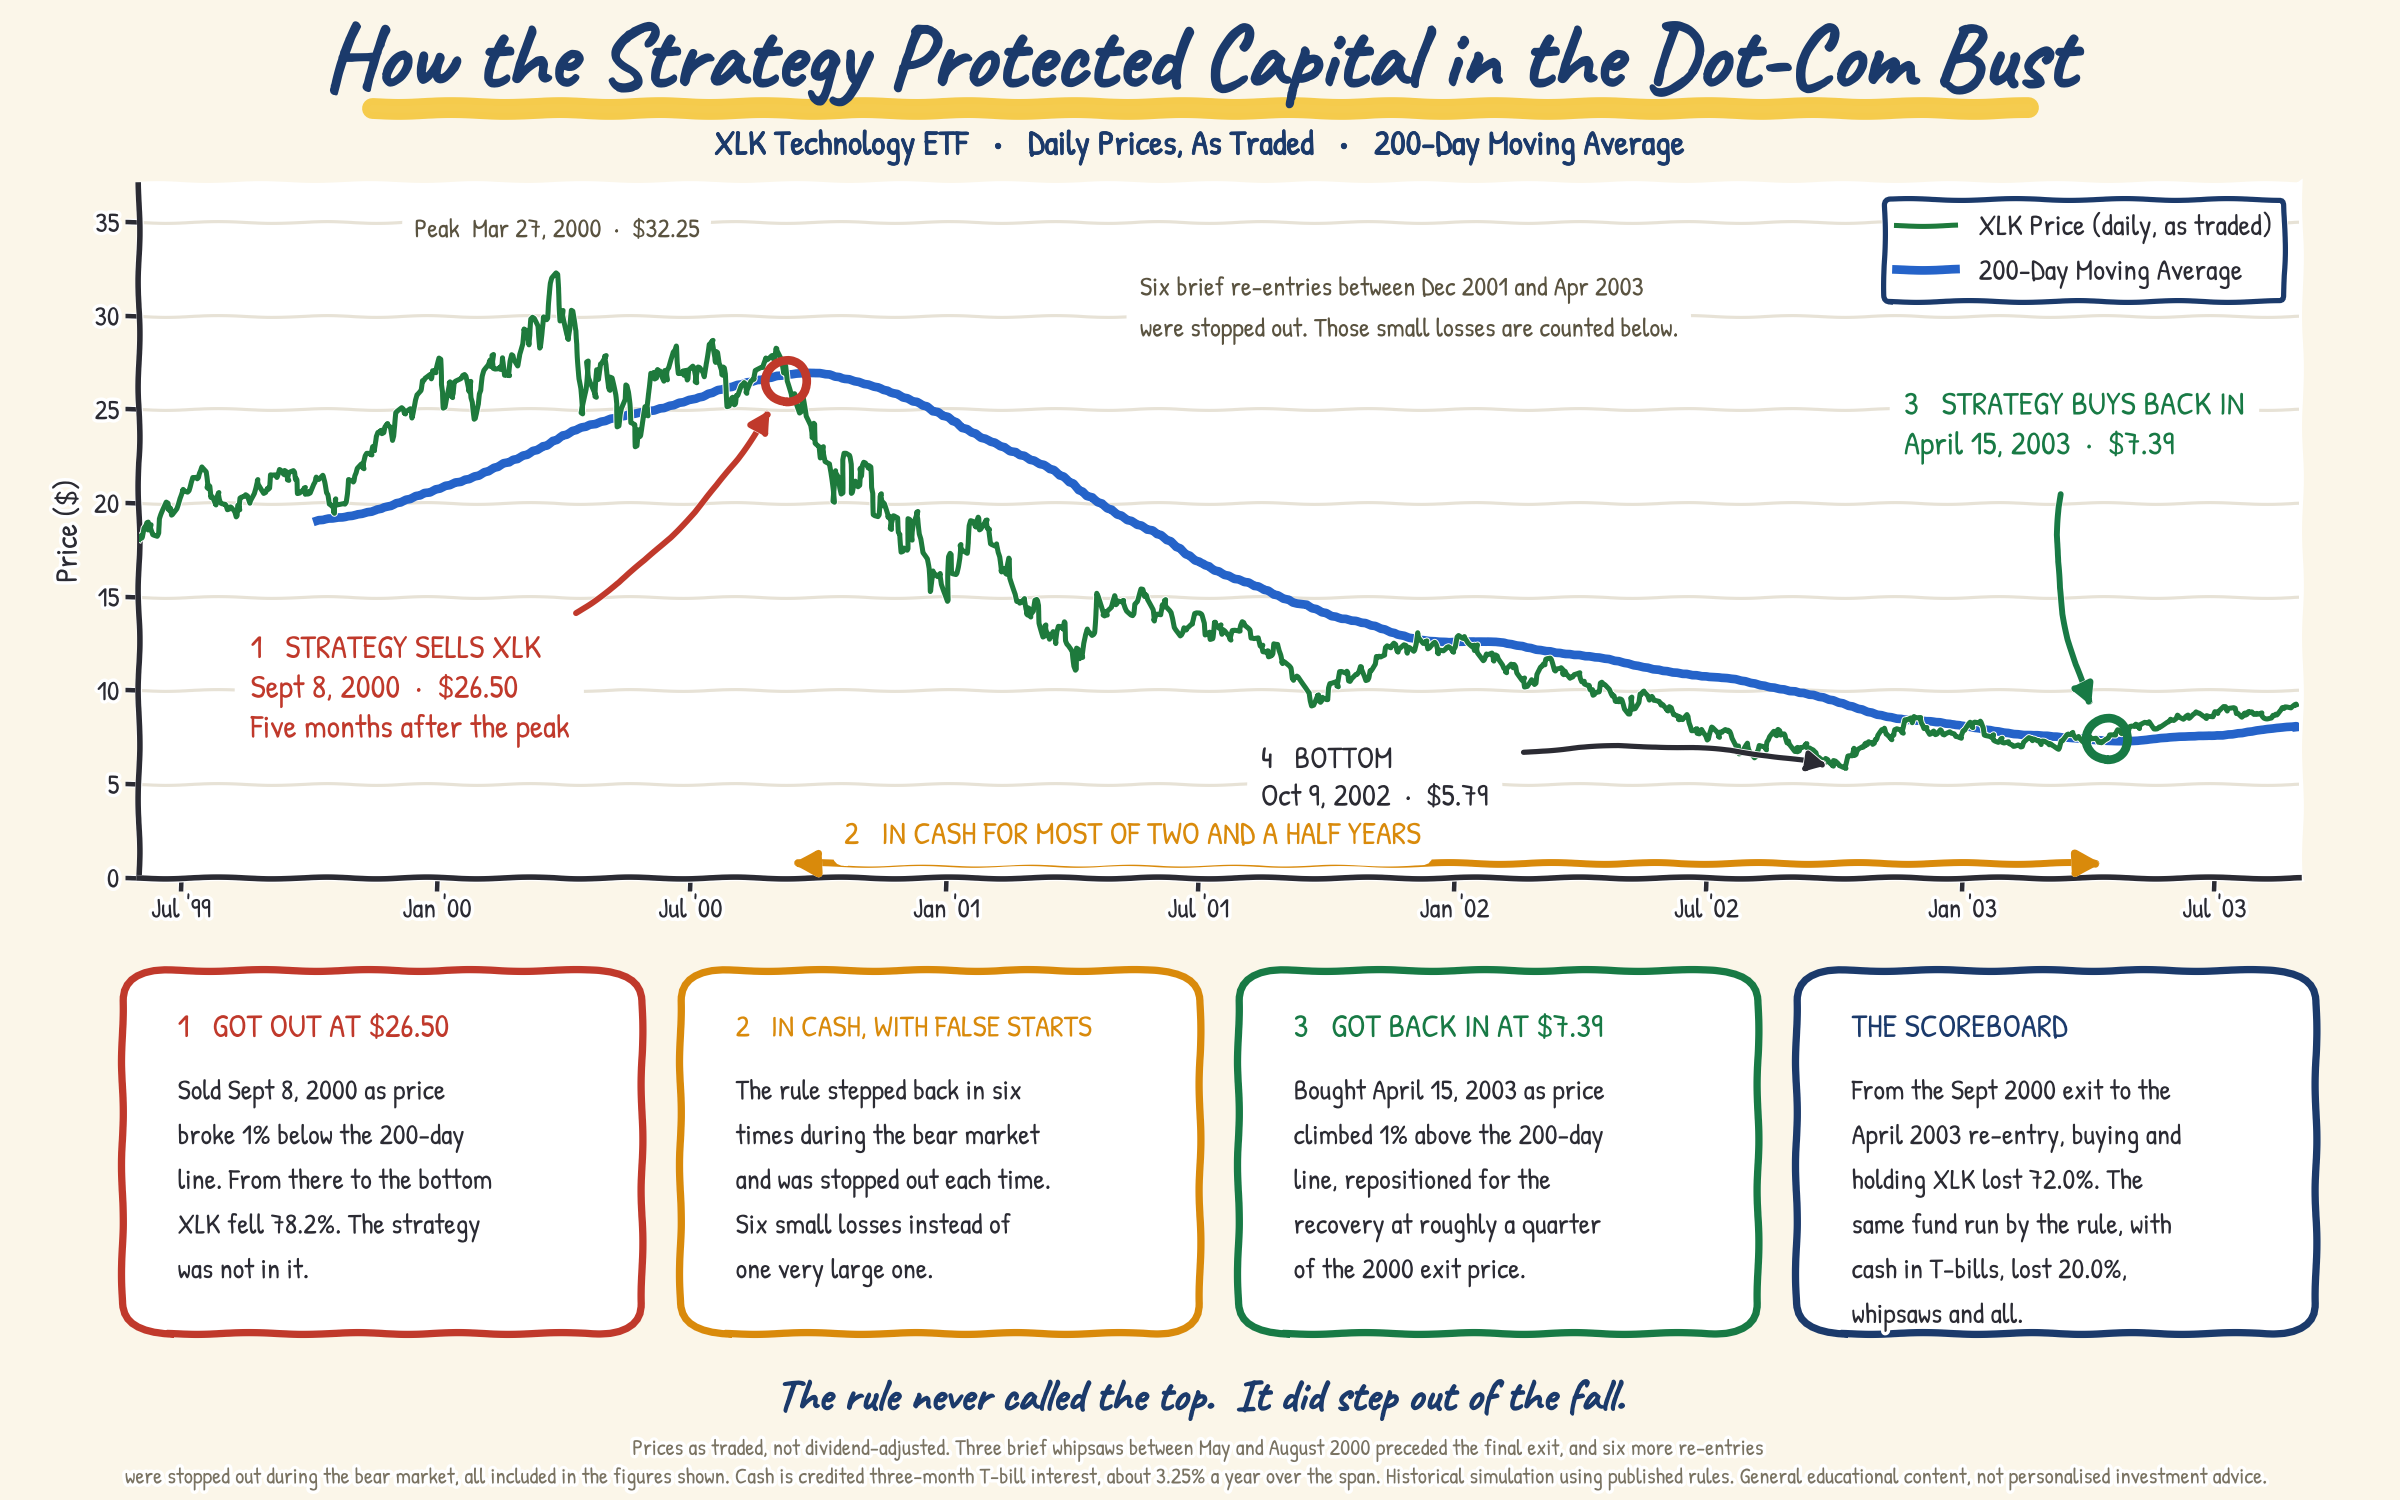
A trend rule in a long, choppy bear market gets fooled. Prices bounce above the moving average line just far enough to trigger a buy, and then roll over again and stop you out at a small loss. That happened to us six separate times between December 2001 and April 2003. Every one of those re-entries lost money.
Six small cuts, none of them a disaster on its own. So when we tally the scoreboard, we count every one of them. Over the stretch from the September 2000 exit to the April 2003 re-entry, simply buying and holding the technology ETF lost 72 percent. The same fund run by our rule, with the cash parked in short-term Treasury bills earning about three and a quarter percent a year, lost 25 percent. Those six whipsaws are already baked into that 25 percent, and the Treasury interest earned while sitting out is helping to offset them.
Jesse Livermore, the famous speculator, said the following. I pulled this from the recent book "1929" by Andrew Ross Sorkin, I could not put the book down. Our strategy actually follows his advice.
Take small losses. Profits always take care of themselves. But losses never do. The speculator has to insure himself against considerable losses by taking the first small loss. In doing so, he keeps his account in order, so that at some future time, when he has a constructive idea, he will be in a position to go into another deal, taking on the same amount of stock as he had when he was wrong.
Across that entire two-and-a-half-year window, roughly 650 trading days, the rule actually held technology on only 38 of them. The other 613 days it sat safely in cash. Almost all of the 25 percent loss came from those 38 nervous days of false starts, not from any long exposure to the decline. The rule spent the crash on the sidelines, poked its head out a half-dozen times, got it knocked back each time, and still came out 52 percent ahead of an investor who simply held the sector throughout.
Take the entire life of this technology fund, from the end of 1998 through today, about twenty seven years, through the dot-com bust, the financial crisis, 2020, 2022, and everything in between.
Over that full stretch, the two paths ended up in almost the same place on return. Simply buying and holding technology compounded at about 10.2 percent a year. The very same fund run by our rule, with the idle cash earning the ordinary short-term Treasury interest it would actually have collected while sitting out, compounded at about 10.0 percent a year. The two finished within a fifth of a point of each other, close enough to call a tie.
The returns were a wash and the ride was anything but, which is the point. The same twenty seven years sit side by side below.
| Whole period, end of 1998 to today | Growth per year | Worst fall, peak to trough |
|---|
| XLK, held straight through | 10.2% | −82% |
| The 200-day rule on XLK, cash in T-bills | 10.0% | −47% |
For about the same return over twenty seven years, once you count the interest on cash, the rule cut the worst peak-to-trough fall roughly in half, from a punishing 82 percent down to the high forties.
John
Prices as traded, not dividend-adjusted. The 2000 to 2003 crisis figures cover September 11, 2000 through April 15, 2003, with cash credited the actual three-month Treasury-bill rate, about 3.25 percent a year over that window. Whole-period figures cover December 1998 through July 2026: growth per year is the annualised total return, and worst fall is the largest peak-to-trough drawdown; the T-bill row credits idle cash about 3 percent a year. Historical simulation using published rules. General market commentary and educational content only. Not personalised investment advice.