“When the market declines, the strategy reduces exposure as sectors break their averages.” That is true, and not much use to anyone trying to picture it. The reason it works in steps rather than all at once is that each of the eleven sectors has its own 200-day average and crosses it at its own time, so we come out of the market in pieces. Same in reverse when it climbs.
Today we hold nine of the eleven sectors, which puts us 82 percent invested and 18 percent in cash. The market would have to fall about 2 percent before we sell anything at all, and about 14 percent before we are completely out. On a steady slide down we give back about 7 percent, and past that point we give back nothing more, because by then every position has already been sold. You can stop reading here if that is all you wanted.
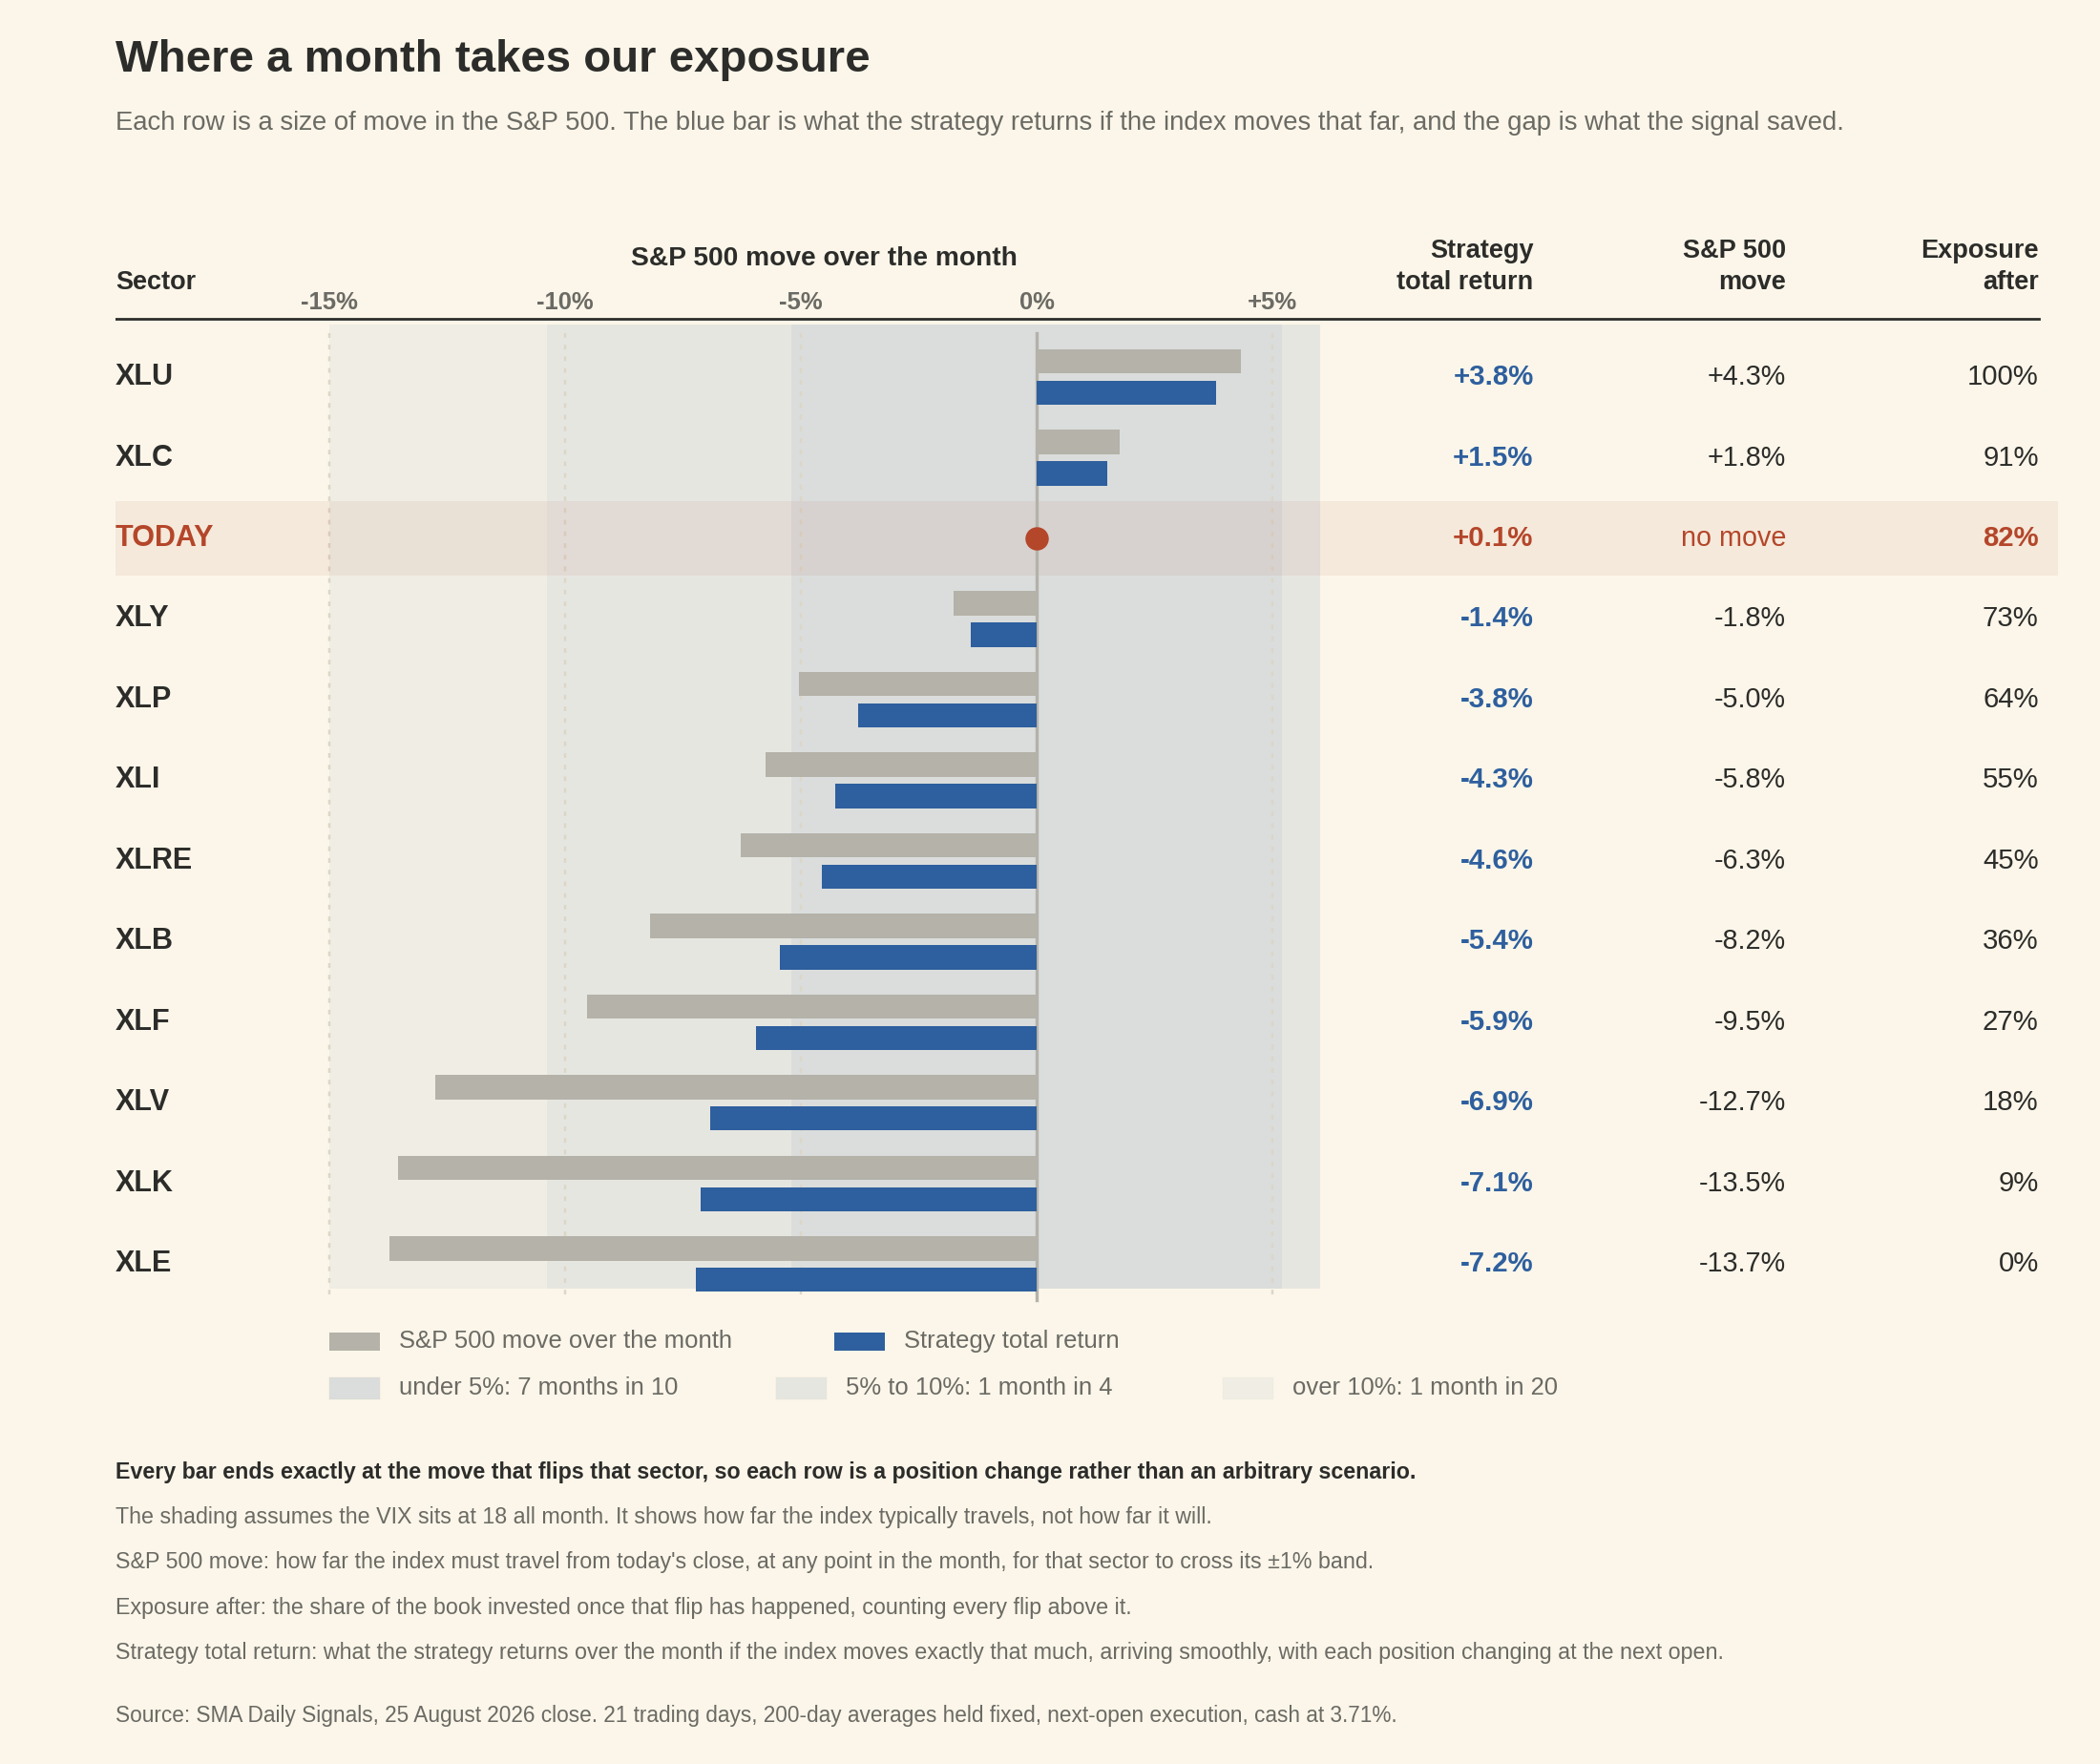
Consumer Discretionary is the most likely first sale, sitting less than 2 percent from its sell signal. Then comes a quiet stretch where nothing happens at all, then Staples, Industrials and Real Estate going within about a point of each other, then Materials and Financials as the slide passes 8 and 9 percent, and finally Health Care, Technology and Energy, which need the market down more than 12 percent before they move. The grey bar is how far the index travelled and the blue bar is what we returned, so the gap between them is what the signal saved. It widens as things get worse. Over the ten years from the end of 1999, that same effect held our worst fall to about 22 percent while the S&P 500’s worst was 55 percent.
The upside works the same way in reverse. A rise of about 2 percent buys Communication Services back and takes us to 91 percent invested, and a rise of about 4 percent triggers the last buy, Utilities, after which we own all eleven sectors and simply move with the market. On a month where the S&P 500 gains 10 percent, which carries us well past that last buy, we make about 9.4 percent, giving up roughly six tenths of a point because we started partly in cash.
Being fully invested means holding all eleven sectors in equal amounts, which behaves differently from the S&P 500, where the largest companies carry most of the weight. This study treats them as moving together to keep the arithmetic clean. Over the ten years from the end of 1999 that difference was worth a great deal, with equal-weight sectors gaining 34 percent while the S&P 500 lost 10 percent, and that gap is the subject of our sector weight study.
Six assumptions sit underneath these numbers, and they are worth listing plainly.
- The move arrives smoothly, a little each day across the month. Real markets zigzag instead, and that whipsaw is the main cost of this strategy, which a smooth path hides.
- Every sector moves exactly with the index. In practice Staples move about a fifth as much as the market on a normal day and Technology about half again as much, but on the worst days they converge toward moving together, which makes one for one a fair working assumption for a study about falling markets.
- The VIX sits at 18 for the whole month. The VIX is the market’s estimate of how much the S&P 500 will move around over the coming month. It was 15.45 at that close, so 18 is the more cautious setting.
- The 200-day averages stay where they are. Over a month they would drift, and in a falling market they would drift down, which would make the sell points slightly harder to reach.
- Positions change at the next open after a signal, which is how we trade and how the study counts it.
- Cash earns 3.71 percent a year, the Treasury bill rate at that close, so the months where we sit partly out still earn something.
What you have then is a map of where the exits are, drawn from today’s prices and averages. It is simplified on purpose, since a version carrying every real-world wrinkle would be harder to read and no more reliable. Every number moves as prices and the averages move, so it is good for about a week.
In summary the two numbers to think about are 2 percent down before anything happens, and 14 percent down before we are all the way out.
John